- Analytics
- News and Tools
- Market News
- AUD/USD Price Analysis: Looks set for a breakdown of 0.6580 ahead of US NFP
AUD/USD Price Analysis: Looks set for a breakdown of 0.6580 ahead of US NFP
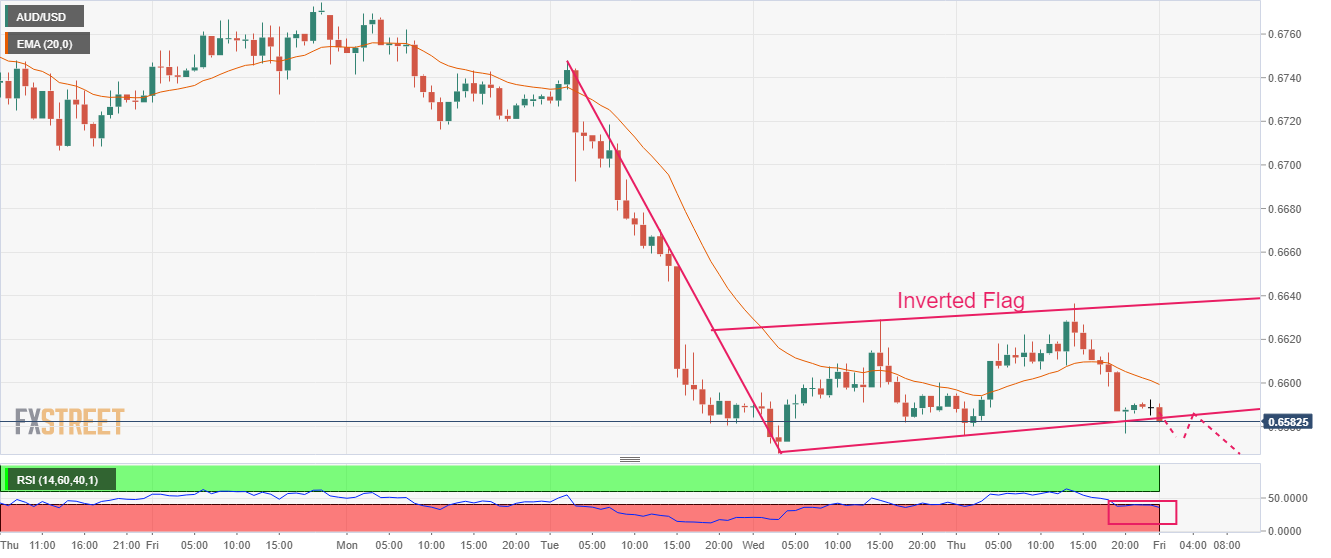
- AUD/USD looks vulnerable around 0.6580 as USD Index is building a cushion around 105.20.
- An Inverted Flag formation favors downside bias for the Aussie asset.
- The RSI (14) has slipped into the bearish range of 20.00-40.00, which indicates that the downside momentum has been triggered.
The AUD/USD pair has delivered a less-confident rebound to near 0.6580 in the Asian session. The Aussie asset is navigating in a territory of 0.6580-0.6636 for the past two trading sessions. Investors should brace for sheer volatility as the release of the United States Nonfarm Payrolls (NFP) data will provide clear guidance.
The US Dollar Index (DXY) is building a cushion around 105.20 after a tad longer gradual correction. The release of the US NFP will trigger action moves as it will guide whether the Federal Reserve (Fed) will continue its moderate pace in hiking interest rates or will return to an aggressive rate hike approach.
Meanwhile, the Australian Dollar is expected to remain on tenterhooks as the Reserve Bank of Australia (RBA) has favored pausing policy-tightening ahead despite a one-time decline in the monthly Consumer Price Index (CPI).
AUD/USD is hovering near the edge of the Inverted Flag chart pattern formed on an hourly scale. An Inverted Flag is a trend-following pattern that displays a long consolidation that is followed by a breakdown. Usually, the consolidation phase of the chart pattern serves as an inventory adjustment in which those participants initiate shorts, which prefer to enter an auction after the establishment of a bearish bias.
The 20-period Exponential Moving Average (EMA) at 0.6600 is acting as a major barricade for the Australian Dollar.
Meanwhile, the Relative Strength Index (RSI) (14) has slipped into the bearish range of 20.00-40.00, which indicates that the downside momentum has been triggered.
Going forward, a breakdown of Wednesday’s low at 0.6568 will drag the asset toward the horizontal support plotted from October 4 high at 0.6547 followed by the round-level support at 0.6500.
In an alternate scenario, a break above Wednesday’s high at 0.6629 will push the Aussie asset toward December 22 low at 0.6650. A break above the same might expose the major to February 27 low near 0.6700.
AUD/USD hourly chart


© 2000-2026. All rights reserved.
This site is managed by Teletrade D.J. LLC 2351 LLC 2022 (Euro House, Richmond Hill Road, Kingstown, VC0100, St. Vincent and the Grenadines).
The information on this website is for informational purposes only and does not constitute any investment advice.
The company does not serve or provide services to customers who are residents of the US, Canada, Iran, The Democratic People's Republic of Korea, Yemen and FATF blacklisted countries.
Making transactions on financial markets with marginal financial instruments opens up wide possibilities and allows investors who are willing to take risks to earn high profits, carrying a potentially high risk of losses at the same time. Therefore you should responsibly approach the issue of choosing the appropriate investment strategy, taking the available resources into account, before starting trading.
Use of the information: full or partial use of materials from this website must always be referenced to TeleTrade as the source of information. Use of the materials on the Internet must be accompanied by a hyperlink to teletrade.org. Automatic import of materials and information from this website is prohibited.
Please contact our PR department if you have any questions or need assistance at pr@teletrade.global.
transfers