- Analytics
- News and Tools
- Market News
- NZD/USD Price Analysis: Fresh upside looks warranted above 0.6280 as hawkish Fed bets fade
NZD/USD Price Analysis: Fresh upside looks warranted above 0.6280 as hawkish Fed bets fade
- NZD/USD is oscillating around 0.6220, resumption in the upside is expected ahead of US CPI.
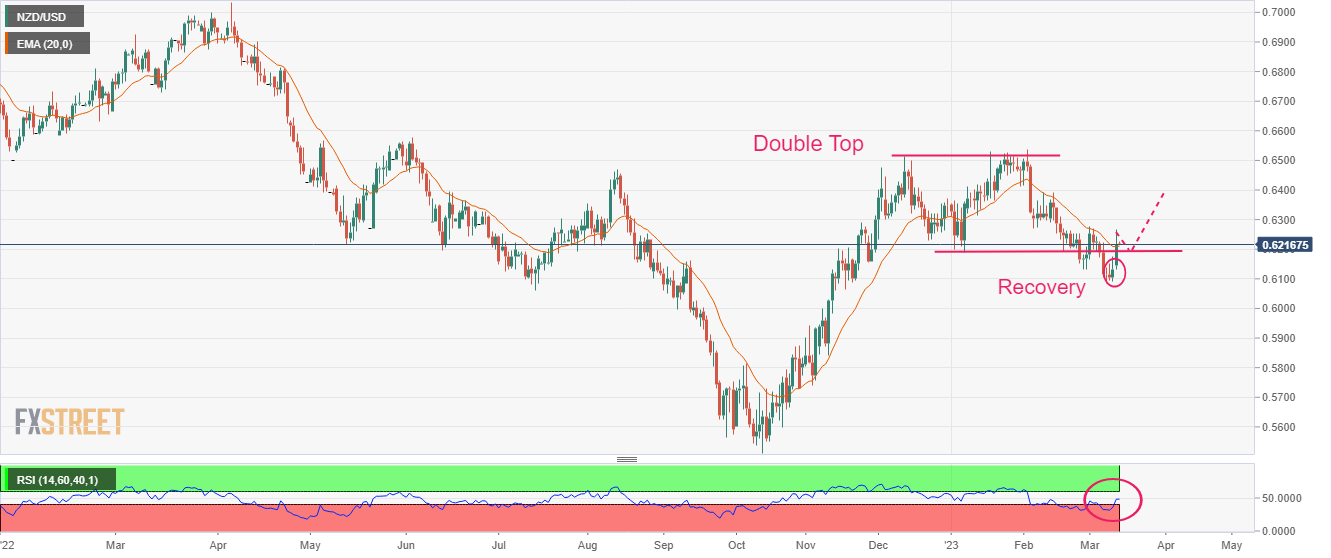
- After a responsive buying, NZD/USD has negated the breakdown of the Double Top chart pattern.
- A decent recovery from the RSI (14) into the 40.00-60.00 range indicates that the presence of responsive buyers.
The NZD/USD pair has turned sideways around 0.6220 in the early Tokyo session after a corrective move from 0.6260. A resumption in the upside momentum is expected from the Kiwi asset as the catastrophic collapse of Silicon Valley Bank (SVB) has faded the hopes of a hawkish stance on the interest rates by the Federal Reserve (Fed).
On the interest rate hike outlook, Goldman Sachs believes "In light of recent stress in the banking system, we no longer expect the FOMC to deliver a rate hike at its March 22 meeting with considerable uncertainty about the path beyond March."
A decent rebound is shown by the S&P500 futures, indicating an improvement in the risk appetite of the market participants. However, caution on a broad basis cannot be ruled out.
The US Dollar Index (DXY) has shown a less-confident recovery from 103.50 and is expected to remain volatile ahead of the release of the Consumer Price Index (CPI) ahead.
NZD/USD has negated the breakdown of the Double Top chart pattern formed on a daily scale. A responsive buying in the Kiwi asset has pushed it above the critical resistance plotted from January 06 low at 0.6190.
The asset is attempting to shift its auction above the 20-period Exponential Moving Average (EMA) at 0.6207, which will improve the short-term upside bias.
A decent recovery from the Relative Strength Index (RSI (14) into the 40.00-60.00 range indicates that the presence of responsive buyers at lower levels.
A buying opportunity in the Kiwi asset will emerge it will surpass March 1 high at 0.6276, which will drive the pair toward the round-level resistance at 0.6300 followed by February 14 high at 0.6389.
In an alternate scenario, a breakdown of January 6 low at 0.6193 will drag the asset toward November 28 low at 0.6155. A slippage below the latter will expose the asset for more downside toward the round-level support at 0.6100.
NZD/USD daily chart


© 2000-2026. All rights reserved.
This site is managed by Teletrade D.J. LLC 2351 LLC 2022 (Euro House, Richmond Hill Road, Kingstown, VC0100, St. Vincent and the Grenadines).
The information on this website is for informational purposes only and does not constitute any investment advice.
The company does not serve or provide services to customers who are residents of the US, Canada, Iran, The Democratic People's Republic of Korea, Yemen and FATF blacklisted countries.
Making transactions on financial markets with marginal financial instruments opens up wide possibilities and allows investors who are willing to take risks to earn high profits, carrying a potentially high risk of losses at the same time. Therefore you should responsibly approach the issue of choosing the appropriate investment strategy, taking the available resources into account, before starting trading.
Use of the information: full or partial use of materials from this website must always be referenced to TeleTrade as the source of information. Use of the materials on the Internet must be accompanied by a hyperlink to teletrade.org. Automatic import of materials and information from this website is prohibited.
Please contact our PR department if you have any questions or need assistance at pr@teletrade.global.
transfers