- Analytics
- News and Tools
- Market News
- USD/MXN Price Analysis: Retakes 19.00 mark, eyes 100-day SMA/38.2% Fibo. confluence hurdle
USD/MXN Price Analysis: Retakes 19.00 mark, eyes 100-day SMA/38.2% Fibo. confluence hurdle
- USD/MXN gains traction for the fourth straight day and trades near a one-month high set on Monday.
- Bulls now await a move beyond the 100-day SMA and 38.2% Fibo. confluence before placing fresh bets.
- Weakness back below the 18.35 horizontal support is needed to offset the near-term positive outlook.
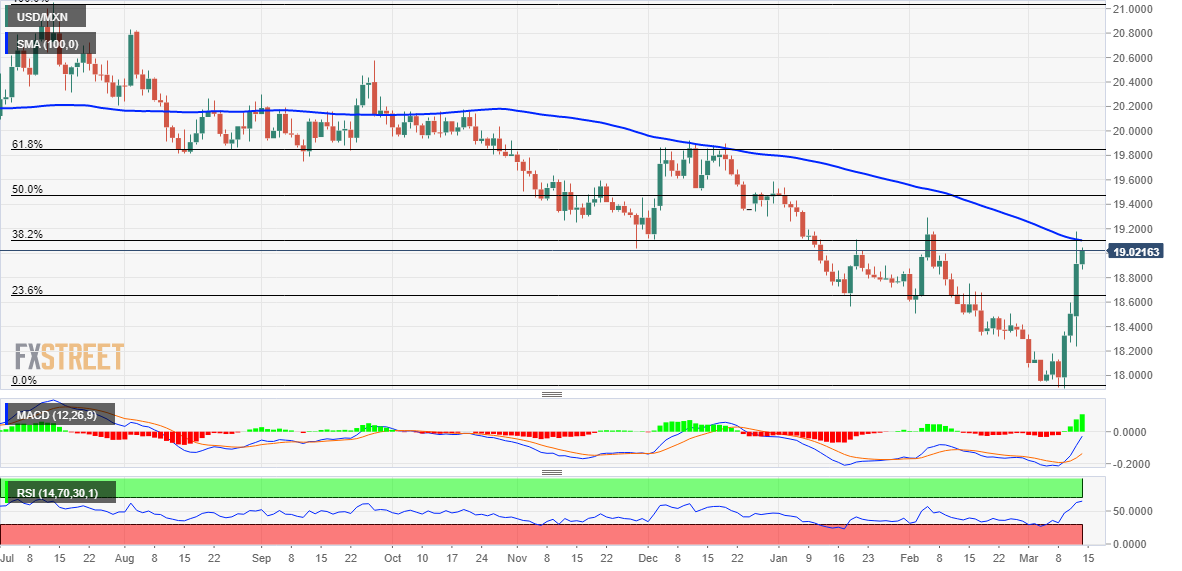
The USD/MXN pair attracts some buying for the fourth successive day on Tuesday and maintains its bid tone through the early part of the European session. The pair steadily climbs back above the 19.00 mark and remains well within the striking distance of over a one-month top touched on Monday.
Given that oscillators on the daily chart are holding in the positive territory and are still far from being in the overbought zone, the technical setup favours bullish traders. That said, the overnight failures to find acceptance above the 100-day Simple Moving Average (SMA) and the 38.2% Fibonacci retracement level of the July 2022-March 2023 downfall warrant caution. This makes it prudent to wait for a convincing break through the said confluence barrier before positioning for any further appreciating move.
The USD/MXN pair could then aim to surpass the February monthly swing high, around the 19.30 region and climb to the 50% Fibo. level, around the mid-19.00s. The upward trajectory could get extended towards testing the 19.75-19.80 horizontal support breakpoint, which now coincides with the 61.8% Fibo. level and should act as a pivotal point. A convincing breakthrough will set the stage for an extension of the recent strong recovery move from sub-18.00 levels, or a multi-year low touched last week.
On the flip side, the 23.6% Fibo. level, around the 18.65 area, now seems to protect the immediate downside ahead of the 18.35 horizontal support. Sustained weakness below will suggest that a one-week-old uptrend has run out of steam and make the USD/MXN pair vulnerable to retesting the 18.00-17.90 support zone.
USD/MXN daily chart
Key levels to watch


© 2000-2026. All rights reserved.
This site is managed by Teletrade D.J. LLC 2351 LLC 2022 (Euro House, Richmond Hill Road, Kingstown, VC0100, St. Vincent and the Grenadines).
The information on this website is for informational purposes only and does not constitute any investment advice.
The company does not serve or provide services to customers who are residents of the US, Canada, Iran, The Democratic People's Republic of Korea, Yemen and FATF blacklisted countries.
Making transactions on financial markets with marginal financial instruments opens up wide possibilities and allows investors who are willing to take risks to earn high profits, carrying a potentially high risk of losses at the same time. Therefore you should responsibly approach the issue of choosing the appropriate investment strategy, taking the available resources into account, before starting trading.
Use of the information: full or partial use of materials from this website must always be referenced to TeleTrade as the source of information. Use of the materials on the Internet must be accompanied by a hyperlink to teletrade.org. Automatic import of materials and information from this website is prohibited.
Please contact our PR department if you have any questions or need assistance at pr@teletrade.global.
transfers