- Analytics
- News and Tools
- Market News
- Gold Price Forecast: XAU/USD retreats as final clues for Federal Reserve decision loom
Gold Price Forecast: XAU/USD retreats as final clues for Federal Reserve decision loom
- Gold price eyes the biggest weekly gains in two months despite easing from 1.5-month high of late.
- XAU/USD bulls cheer softer United States 10-year, two-year Treasury bond yields, improved market sentiment.
- Mixed US data, market’s lack of confidence probe the Gold price buyers of late.
- XAU/USD traders eye Michigan Consumer Sentiment Index, inflation precursor ahead of next week’s Federal Reserve monetary policy meeting.
Gold price (XAU/USD) dribbles around $1,920, after a zigzag session that initially refreshed the six-week high but ended the day without any major moves. That said, the Gold price earlier cheered the softer United States Treasury bond yields before the improvement in market sentiment and a rebound in the bond coupons probed the XAU/USD bulls. Also likely to have probed the Gold buyers could be the cautious mood ahead of next week’s Federal Open Market Committee (FOMC) monetary policy meeting. It’s worth noting, however, that the US bond coupons are down for the second consecutive week and hence allow the bullion to remain firmer on a weekly basis.
Gold price contradicts United States Treasury bond yields
Gold price recently eased from the multi-day high as the United States Treasury bond yields bounced off the latest troughs as the market sentiment improves and traders gear up for the next week’s Federal Reserve (Fed) meeting. Even so, the second consecutive weekly loss for the benchmark bond coupons allows the XAU/USD to brace for a three-week uptrend, as well as the biggest weekly gain since early January.
That said, United States 10-year and two-year Treasury bond yields are down for the second consecutive week despite the previous day’s rebound from the multi-day low. It should be noted that the US 10-year Treasury bond yields bounced off a six-week low to end Thursday’s North American trading session around 3.58% while the two-year counterpart recovered from the lowest level since mid-September 2022 to 4.17% at the latest.
It’s worth noting that the recent shrinking in the US 10-year and two-year Treasury bond yields inversion seems to help the Gold buyers.
Jittery markets, mixed US data also please XAU/USD bulls
Gold price pullback could be linked to the latest actions from global policymakers and banks to tame the banking industry fallout. However, the investors aren’t all in and remain cautious as some of the latest market performance resembles the 2008 financial crisis. Apart from the sentiment, the mixed United States data also probe the Gold buyers but allow the XAU/USD to remain firmer amid receding hopes of higher Federal Reserve (Fed) rates.
On Wednesday, Saudi National Bank, the largest shareholder of Credit Suisse Group AG, ruled out another call for additional liquidity and triggered the financial market rout as Credit Suisse is a G-SIB – a global systemically important bank and the drama erupts after the latest fallouts of the US banks, namely Silicon Valley Bank (SVB) and Signature Bank.
However, comments from Saudi National Bank's Chairman, Ammar Al Khudairy, shared by Bloomberg, eased the market’s pain as the bank leader mentioned Credit Suisse Group AG isn’t likely to seek more capital and the bank is generally “sound”. On the same line is the news that major US banks are working with the government to support California-based First Republic Bank to avoid a liquidity crunch.
The news that Credit Suisse eyes borrowing up to CHF50 billion from the Swiss National Bank (SNB) to strengthen liquidity also gained attention while Reuteres’ news that anonymous sources conveyed that the US banks are less vulnerable to the Credit Suisse debacle helped sentiment too. Additionally convincing the markets were comments from US Treasury Secretary Janet Yellen saying, “I can reassure the members of the committee that our banking system remains sound, and that Americans can feel confident that their deposits will be there when they need them."
It should be noted that the European Central Bank’s (ECB) 50 bps rate hike, matching expectations, also favored the sentiment and allowed the latest rebound in the yields, which in turn probed the Gold buyers.
On a different page, US Weekly Initial Jobless Claims dropped to 192K for the week ended on March 10 versus 205K expected and 212K prior whereas the four-week average figure dropped to 196.5K versus 197.25K prior (revised). Further, Housing Starts jumped to 1.45M in February from 1.321M previous reading and 1.31M analysts’ estimations while the Housing Starts jumped to 1.524M during the said month versus 1.34M expected and 1.339M prior. Additionally, the Philadelphia Fed Manufacturing Survey gauge came in as -23.2 compared to -14.5 consensus and -24.3 prior.
It’s worth mentioning that the Fed fund futures recently bolster the case of the US central bank’s 0.25% rate hike in the next week’s monetary policy meeting.
Amid these plays, Wall Street closed in the green with more than 1.0% gains by each of the benchmark indices whereas US Dollar Index (DXY) marked the negative daily closing.
Looking ahead, Gold traders should pay attention to the Michigan Consumer Sentiment Index for March and the UoM 5-year Inflation Expectation for clear directions as these are the final clues for the next week’s Fed meeting.
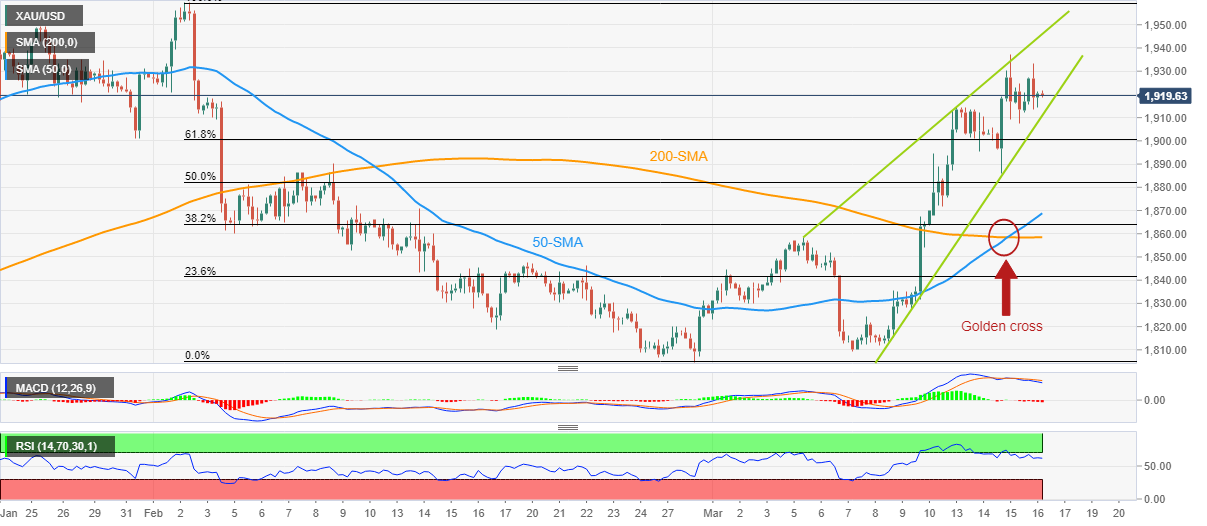
Gold price technical analysis
Gold price portrays a rising wedge bearish chart formation on the four-hour play. Also challenging the XAU/USD bulls is the overbought conditions of the Relative Strength Index (RSI) line, placed at 14, as well as sluggish signals from the Moving Average Convergence and Divergence (MACD) indicator.
With this, the stated wedge’s upper line, currently around $1,945, appears the key hurdle for the Gold price to tackle to avoid chances of a pullback. Even so, the Year-To-Date (YTD) high surrounding $1,960 can act as an extra filter toward the north.
Meanwhile, a downside break of the stated wedge’s support line, close to $1,913 at the latest, could confirm the bearish chart pattern suggesting a theoretical target of $1,790. During the anticipated fall, the 50-bar and 200-bar Simple Moving Averages (SMAs), around $1,866 and $1,858 respectively, will precede the $1,800 threshold to test the Gold bears.
It’s worth noting, however, that the 50-SMA stays well beyond the 200-SMA and portrays a “golden cross” suggesting the metal’s further upside.
Hence, the XAU/USD is likely to grind higher inside the aforementioned bearish chart formation.
Gold price: Four-hour chart
Trend: Limited upside expected


© 2000-2026. All rights reserved.
This site is managed by Teletrade D.J. LLC 2351 LLC 2022 (Euro House, Richmond Hill Road, Kingstown, VC0100, St. Vincent and the Grenadines).
The information on this website is for informational purposes only and does not constitute any investment advice.
The company does not serve or provide services to customers who are residents of the US, Canada, Iran, The Democratic People's Republic of Korea, Yemen and FATF blacklisted countries.
Making transactions on financial markets with marginal financial instruments opens up wide possibilities and allows investors who are willing to take risks to earn high profits, carrying a potentially high risk of losses at the same time. Therefore you should responsibly approach the issue of choosing the appropriate investment strategy, taking the available resources into account, before starting trading.
Use of the information: full or partial use of materials from this website must always be referenced to TeleTrade as the source of information. Use of the materials on the Internet must be accompanied by a hyperlink to teletrade.org. Automatic import of materials and information from this website is prohibited.
Please contact our PR department if you have any questions or need assistance at pr@teletrade.global.
transfers