- Analytics
- News and Tools
- Market News
- Gold Price Forecast: XAU/USD corrects to near $1,970 on UBS-Credit Suisse deal, Fed policy eyed
Gold Price Forecast: XAU/USD corrects to near $1,970 on UBS-Credit Suisse deal, Fed policy eyed
- Gold price has corrected to near $1,970.00 as investors are getting anxious about the Fed policy.
- Safe-haven appeal for Gold has been trimmed as UBS promised to rescue Credit Suisse.
- Gold bulls are experiencing a momentum loss and are expected to deliver a mean reversion to near the 20-EMA.
Gold price (XAU/USD) corrected to near $1,970.00 after UBS announced the Credit Suisse rescue plan. The precious metal is gauging a cushion around the $1,970.00 support, however, further correction looks possible.
Investors should be aware of the fact that the market participants were pumping funds into the yellow metal to safeguard themselves from the volatility associated with a potential banking fiasco. A buyout deal by UBS has trimmed fears of global banking turmoil. The buyout deal has sent a signal that central banks are prepared to provide assistance to commercial banks in order to retrieve the confidence of investors.
The US Dollar Index (DXY) is demonstrating a back-and-forth action around 103.80 as the market is preparing for the interest rate decision by the Federal Reserve (Fed), which is scheduled for Wednesday. Analysts at Danske Bank see Fed chair Jerome Powell raising rates by 25 basis points (bps) despite recent turmoil amid banking sector jitters.
Bulk morning gains generated by the S&P500 futures are halved now, portraying that the UBS-Credit Suisse deal is not sufficient enough to deal with the global banking jitters. Negative market sentiment would stay for a period of time as the banking mess is still to show true colors. Meanwhile, the UBS-Credit Suisse deal has trimmed demand for US government bonds, which were being considered as safe-haven. This has pushed the 10-year US Treasury yields higher to 3.46%.
Gold technical analysis
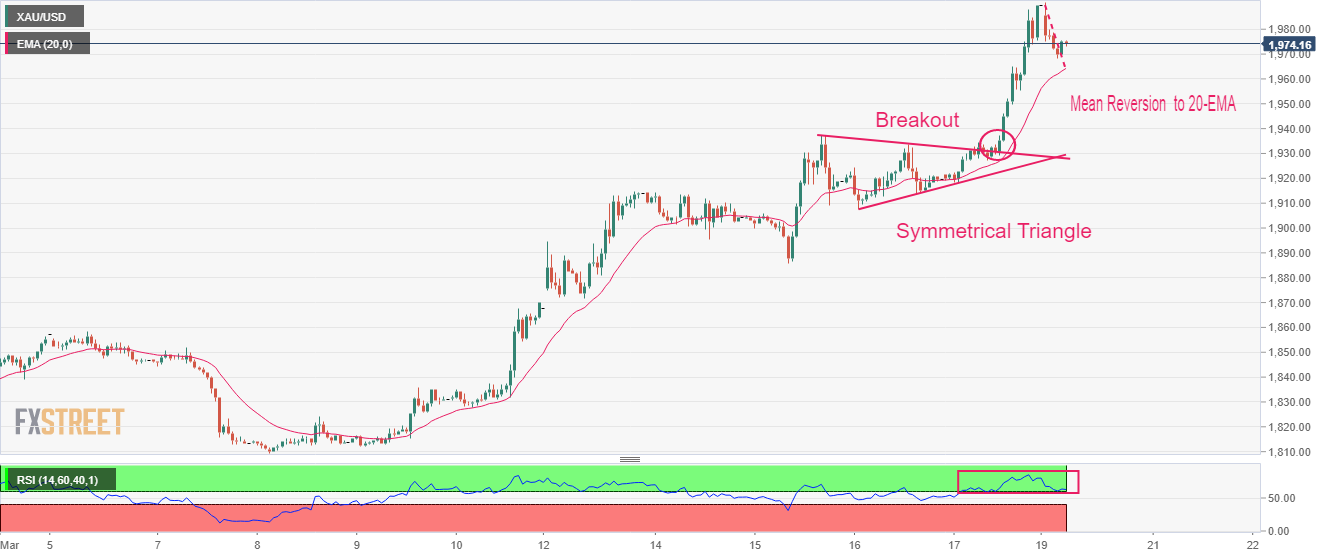
Gold price delivered a stalwart rally after a breakout of the Symmetrical Triangle chart pattern on an hourly scale. A breakout in the aforementioned chart pattern is followed by heavy volume and wide ticks. After a perpendicular rally, Gold bulls are experiencing a momentum loss and are expected to deliver a mean-reversion to near the 20-period Exponential Moving Average (EMA) at $1,964.00.
The Relative Strength Index (RSI) (14) is oscillating in the bullish range of 60.00-80.00, which indicates that the upside momentum is extremely solid.
Gold hourly chart


© 2000-2026. All rights reserved.
This site is managed by Teletrade D.J. LLC 2351 LLC 2022 (Euro House, Richmond Hill Road, Kingstown, VC0100, St. Vincent and the Grenadines).
The information on this website is for informational purposes only and does not constitute any investment advice.
The company does not serve or provide services to customers who are residents of the US, Canada, Iran, The Democratic People's Republic of Korea, Yemen and FATF blacklisted countries.
Making transactions on financial markets with marginal financial instruments opens up wide possibilities and allows investors who are willing to take risks to earn high profits, carrying a potentially high risk of losses at the same time. Therefore you should responsibly approach the issue of choosing the appropriate investment strategy, taking the available resources into account, before starting trading.
Use of the information: full or partial use of materials from this website must always be referenced to TeleTrade as the source of information. Use of the materials on the Internet must be accompanied by a hyperlink to teletrade.org. Automatic import of materials and information from this website is prohibited.
Please contact our PR department if you have any questions or need assistance at pr@teletrade.global.
transfers