- Analytics
- News and Tools
- Market News
- Gold Price Forecast: XAU/USD struggles to remain above $1,940 as fears of US banking crisis trim
Gold Price Forecast: XAU/USD struggles to remain above $1,940 as fears of US banking crisis trim
- Gold price is making efforts for maintaining its auction above $1,940.00.
- The recent rally in the Gold price was driven was weakness in the USD Index and fears of a banking sector meltdown.
- The USD Index is showing a subdued performance as odds for a 25bp rate hike by the Fed are accelerating.
Gold price (XAU/USD) has reverted to the $1,940.00 support after failing to extend its recovery above $1,946.00 in the Asian session. The precious metal is expected to remain sideways as investors are likely to execute meaningful positions after the announcement of the interest rate decision by the Federal Reserve (Fed).
It is worth noting that the Gold price is struggling to maintain its feet despite a subdued performance by the US Dollar Index (DXY). The recent rally in the Gold price was driven was weakness in the USD Index and stalwart fears of a banking sector meltdown in the United States after the collapse of three mid-size banks last week.
The commentary from United States Treasury Secretary Janet Yellen that Fed’s new Bank Term Funding facility and discount window lending are working to provide liquidity to the banking system has trimmed fears of further turmoil in the banking system. Also, the statement infused fresh blood into the share price of First Republic Bank on Tuesday. Earlier, the safe-haven appeal for Gold got firmer as investors shifted their money to bullions to safeguard themselves from sheer volatility.
The US Dollar Index (DXY) is continuously hovering around 103.20 as investors are cheering accelerating odds for a 25 basis point (bp) interest rate hike by the Fed. As per the CME Fedwatch tool, 85% chances are in favor of a 25bp rate hike, which would push rates to 4.75-5.00%.
Gold technical analysis
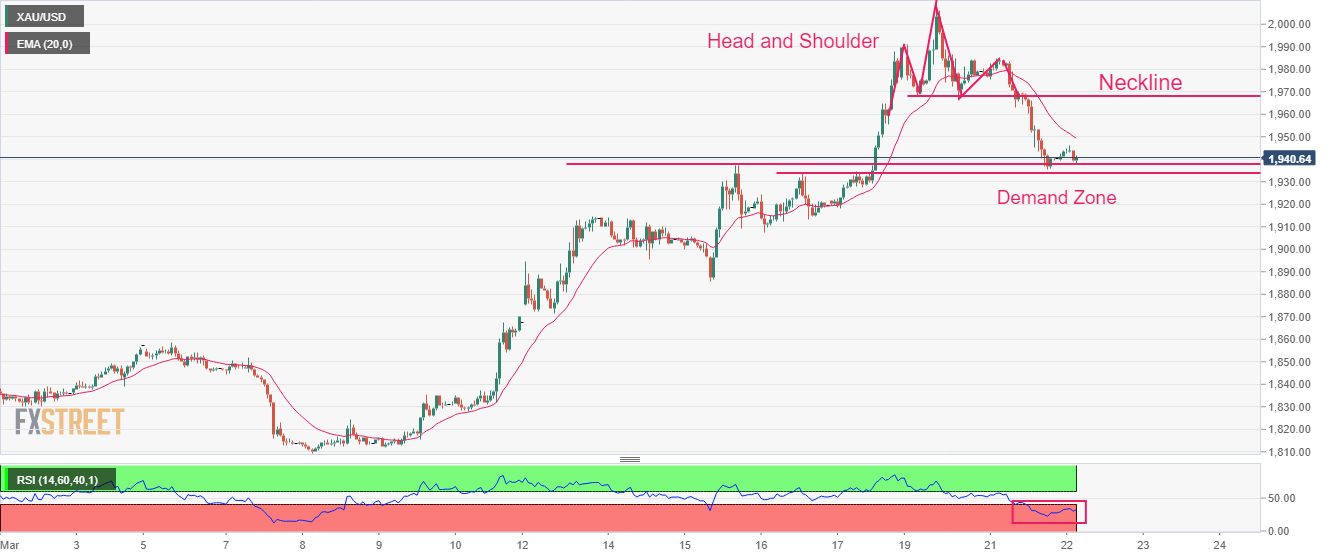
Gold price delivered a perpendicular decline after a breakdown of the Head and Shoulder chart pattern on an hourly scale. A breakdown of the aforementioned chart pattern indicates a bearish reversal after a consolidation move. The Gold price has dropped to near the demand zone placed in a range of $1,933.90-1,938.40.
The 20-period Exponential Moving Average (EMA) at around $1,950.00 would continue to act as a barricade for Gold bulls.
Meanwhile, the Relative Strength Index (RSI) (14) is oscillating in the bearish range of 20.00-40.00, which indicates the downside momentum is still active.
Gold hourly chart


© 2000-2026. All rights reserved.
This site is managed by Teletrade D.J. LLC 2351 LLC 2022 (Euro House, Richmond Hill Road, Kingstown, VC0100, St. Vincent and the Grenadines).
The information on this website is for informational purposes only and does not constitute any investment advice.
The company does not serve or provide services to customers who are residents of the US, Canada, Iran, The Democratic People's Republic of Korea, Yemen and FATF blacklisted countries.
Making transactions on financial markets with marginal financial instruments opens up wide possibilities and allows investors who are willing to take risks to earn high profits, carrying a potentially high risk of losses at the same time. Therefore you should responsibly approach the issue of choosing the appropriate investment strategy, taking the available resources into account, before starting trading.
Use of the information: full or partial use of materials from this website must always be referenced to TeleTrade as the source of information. Use of the materials on the Internet must be accompanied by a hyperlink to teletrade.org. Automatic import of materials and information from this website is prohibited.
Please contact our PR department if you have any questions or need assistance at pr@teletrade.global.
transfers