- Analytics
- News and Tools
- Market News
- NZD/USD Price Analysis: Builds cushion near lower end of rising channel around 0.6200
NZD/USD Price Analysis: Builds cushion near lower end of rising channel around 0.6200
- NZD/USD is building a cushion near the lower end of the Rising Channel around 0.6200.
- A responsive buying for the New Zealand Dollar is highly expected as the US Dollar has shown correction.
- Fewer chances of continuation of ongoing increases by the Fed have heavily impacted US Treasury yields.
The NZD/USD pair is displaying a back-and-forth action in a narrow range of 0.6191-0.6212 continuously since Friday. The Kiwi asset has turned sideways and signs of recovery are solidifying as the US Dollar Index (DXY) has shown some correction.
The USD Index (DXY) has corrected to near 103.00 after failing to extend recovery above 103.36. S&P500 futures have generated solid gains in the morning session on hopes that more financial support to mid-size United States lenders from the Federal Reserve (Fed) would infuse confidence among investors and in households for making more deposits.
Fewer chances of continuation of ongoing increases in the interest rate by the Federal Reserve (Fed) after the banking fiasco have heavily impacted US Treasury yields. The return offered on 10-year US Treasury bonds has dropped sharply to near 3.37%. Contrary, economists at Goldman Sachs believe that the Fed will announce two more rate hikes in May and June by 25 basis points (bps).
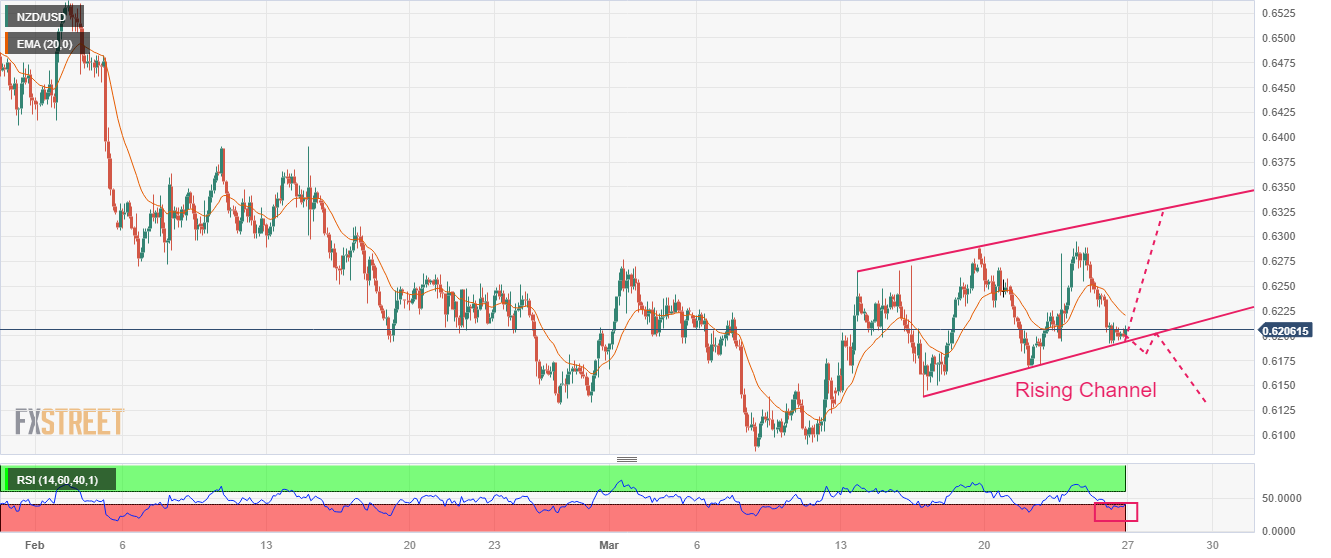
NZD/USD is demonstrating a small inventory adjustment near the lower edge of the Rising Channel chart pattern formed on a two-hour scale. In a Rising Channel chart pattern corrective moves are considered as buying opportunities by the market participants.
The Kiwi asset is auctioning below the 20-period Exponential Moving Average (EMA) at 0.6222, which indicates that the short-term bias is still on the downside.
Meanwhile, the Relative Strength Index (RSI) (14) has slipped into the bearish range of 20.00-40.00, which also favors a downside bias.
An extension of recovery above March 07 high at 0.6223 will drive the asset toward March 13 high at 0.6265 followed by the upper end of the chart pattern around 0.6325.
On the flip side, a breakdown of March 21 low at 0.6167 will drag the asset toward March 15 low at 0.6139. A slippage below the latter will expose the asset for more downside toward the round-level support at 0.6100.
NZD/USD two-hour chart


© 2000-2026. All rights reserved.
This site is managed by Teletrade D.J. LLC 2351 LLC 2022 (Euro House, Richmond Hill Road, Kingstown, VC0100, St. Vincent and the Grenadines).
The information on this website is for informational purposes only and does not constitute any investment advice.
The company does not serve or provide services to customers who are residents of the US, Canada, Iran, The Democratic People's Republic of Korea, Yemen and FATF blacklisted countries.
Making transactions on financial markets with marginal financial instruments opens up wide possibilities and allows investors who are willing to take risks to earn high profits, carrying a potentially high risk of losses at the same time. Therefore you should responsibly approach the issue of choosing the appropriate investment strategy, taking the available resources into account, before starting trading.
Use of the information: full or partial use of materials from this website must always be referenced to TeleTrade as the source of information. Use of the materials on the Internet must be accompanied by a hyperlink to teletrade.org. Automatic import of materials and information from this website is prohibited.
Please contact our PR department if you have any questions or need assistance at pr@teletrade.global.
transfers