- Analytics
- News and Tools
- Market News
- Gold Price Forecast: XAU/USD stabilizes above $1,970 as focus shifts to US FOMC minutes
Gold Price Forecast: XAU/USD stabilizes above $1,970 as focus shifts to US FOMC minutes
- Gold price has shifted comfortably above $1,970.00 ahead of FOMC minutes.
- The release of May’s FOMC minutes will provide a detailed explanation behind 25 bps interest rate hike by the Fed.
- Mixed preliminary S&P PMI data (May) weighed on US Treasury yields.
Gold price (XAU/USD) has shifted its auction comfortably above the crucial resistance of $1,970.00 in the Asian session. The precious metal is expected to extend its rally further ahead of the release of the Federal Open Market Committee (FOMC) minutes for May’s monetary policy meeting on Wednesday.
S&P500 futures witnessed a steep fall on Tuesday, dragged by a sell-off in technology stocks. The market mood remained negative as the United States economy is getting closer to a situation of default as the Federal government will be out of funds by June 01. An absence of positive development in raising the US debt-ceiling is terrifying investors as a default by the US economy could result in chaos in global financial markets and a spike in interest rates.
The US Dollar Index (DXY) is showing signs of volatility contraction after gaining to near the previous week’s high above 103.60. Going forward, the release of May’s FOMC minutes will provide a detailed explanation behind the 25 basis points (bps) interest rate hike by the Federal Reserve (Fed). Also, it will provide cues about upcoming policy action.
Meanwhile, the release of the mixed preliminary S&P PMI data (May) weighed on US Treasury yields. The Yields offered on 10-year US government bonds dropped below 3.70%.
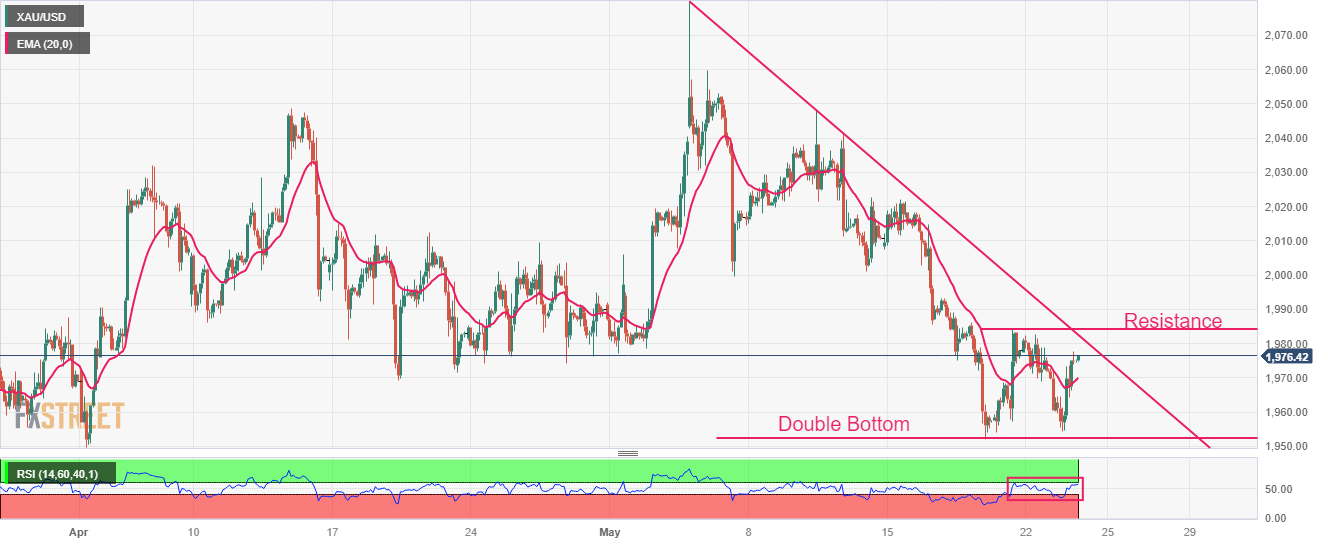
Gold technical analysis
Gold price has shown a stellar recovery after a Double Bottom formation plotted from May 18 low at $1,952.01, which indicates a bullish reversal. Gold bulls will get further strength after breaking above the immediate resistance placed from March 19 high at $1,984.25. The downward-sloping trendline market from all-time highs at $2,079.76 will act as a major barrier for the Gold price.
The yellow metal has climbed above the 20-period Exponential Moving Average (EMA) at $1,970.00, which indicates that the short-term trend has turned positive.
Meanwhile, the Relative Strength Index (RSI) (14) has shifted into the 40.00-60.00 range from the bearish range of 20.00-40.00, which signals that the downside momentum has faded.
Gold hourly chart


© 2000-2026. All rights reserved.
This site is managed by Teletrade D.J. LLC 2351 LLC 2022 (Euro House, Richmond Hill Road, Kingstown, VC0100, St. Vincent and the Grenadines).
The information on this website is for informational purposes only and does not constitute any investment advice.
The company does not serve or provide services to customers who are residents of the US, Canada, Iran, The Democratic People's Republic of Korea, Yemen and FATF blacklisted countries.
Making transactions on financial markets with marginal financial instruments opens up wide possibilities and allows investors who are willing to take risks to earn high profits, carrying a potentially high risk of losses at the same time. Therefore you should responsibly approach the issue of choosing the appropriate investment strategy, taking the available resources into account, before starting trading.
Use of the information: full or partial use of materials from this website must always be referenced to TeleTrade as the source of information. Use of the materials on the Internet must be accompanied by a hyperlink to teletrade.org. Automatic import of materials and information from this website is prohibited.
Please contact our PR department if you have any questions or need assistance at pr@teletrade.global.
transfers