- Analytics
- News and Tools
- Market News
- US Dollar Index: Reclaims 200-day EMA, surpasses 2017 yearly high, as bulls stepped in eyeing 104.000
US Dollar Index: Reclaims 200-day EMA, surpasses 2017 yearly high, as bulls stepped in eyeing 104.000
- The US Dollar Index (DXY) gains 0.36%, trading at 103.888, maintaining a rally for three days and surpassing the 200-day EMA.
- DXY must hit 105.883 YTD high to confirm the double-bottom pattern, surpassing multiple resistances.
- Potential risks lie beneath the 200-day EMA; breaking it may lead DXY toward 100-day EMA at 103.212 and May 22's 102.964 low.
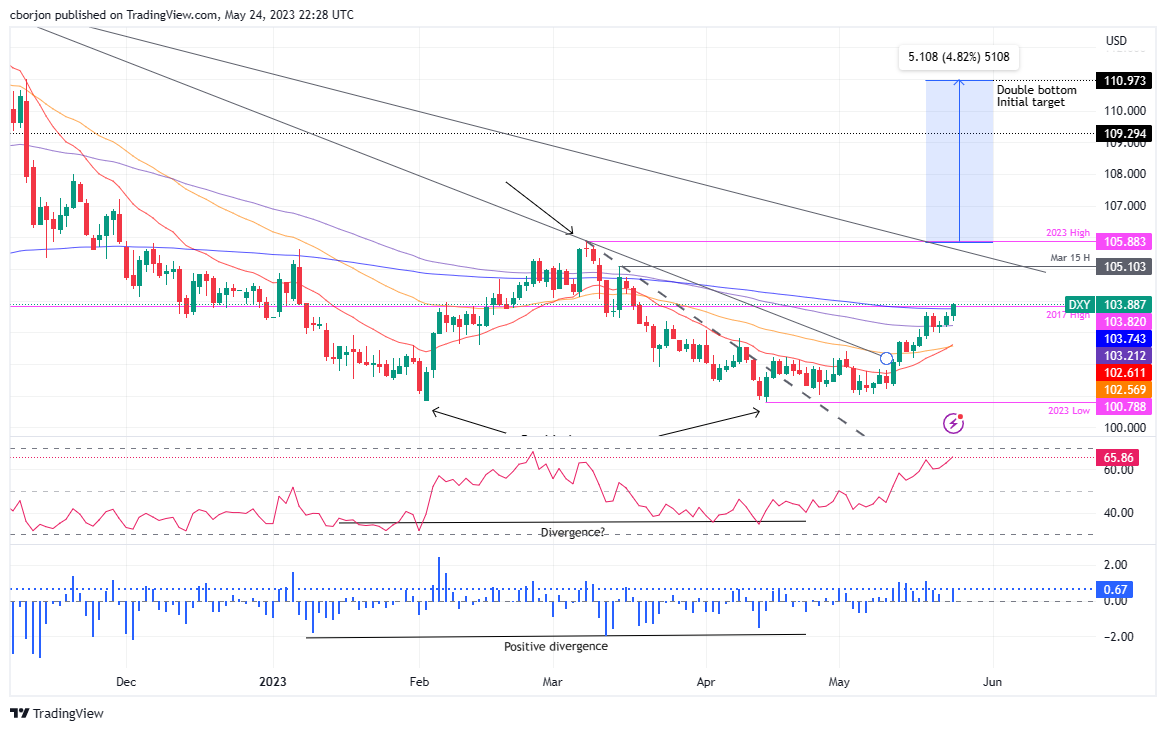
The US Dollar Index (DXY), which measures a basket of six currencies against the US Dollar (USD), rallies for three straight days, reclaims the 200-day Exponential Moving Average (EMA) at 103.743 and is also exchanging hands above the 2017 yearly high of 103.820. At the time of writing, the DXY is trading hands at 103.888, gaining 0.36%, with bulls eyeing the 104.000 mark.
US Dollar Index Price Analysis: Technical outlook
From a daily chart perspective, the US Dollar Index is neutral to bullish biased, but it could cement its bias as bullish once the DXY achieves a decisive break above the 200-day EMA. It should be said that the double-bottom that emerged in the weekly chart, as I wrote in a news article on April 14, US Dollar Index: Could a double bottom at the weekly chart drive the DXY to 111.000? remains in play.
However, to validate the double-bottom chart pattern, the DXY must get to the year-to-date (YTD) high of 105.883, though the greenback needs to hurdle some resistance levels on its way up. Meanwhile, the Relative Strength Index (RSI) indicator is in bullish territory, with some room before hitting overbought levels, while the 3-day Rate of Change (RoC) suggests that buyers are gathering momentum.
If the DXY reclaims 104.000, the next resistance level to test would be the March 15 daily high of 105.103. Break above, and the DXY will have a clear run toward testing an eight-month-old resistance trendline around the 105.300-600 area, ahead of piercing the YTD high at 105.883
Downside risks for the DXY remain below the 200-day EMA, which could send the greenback sliding towards the 100-day EMA at 103.212. A clear break will send the DXY toward the May 22 swing low of 102.964, slightly below the 103.000 mark.
US Dollar Index Price Action – Daily chart


© 2000-2026. All rights reserved.
This site is managed by Teletrade D.J. LLC 2351 LLC 2022 (Euro House, Richmond Hill Road, Kingstown, VC0100, St. Vincent and the Grenadines).
The information on this website is for informational purposes only and does not constitute any investment advice.
The company does not serve or provide services to customers who are residents of the US, Canada, Iran, The Democratic People's Republic of Korea, Yemen and FATF blacklisted countries.
Making transactions on financial markets with marginal financial instruments opens up wide possibilities and allows investors who are willing to take risks to earn high profits, carrying a potentially high risk of losses at the same time. Therefore you should responsibly approach the issue of choosing the appropriate investment strategy, taking the available resources into account, before starting trading.
Use of the information: full or partial use of materials from this website must always be referenced to TeleTrade as the source of information. Use of the materials on the Internet must be accompanied by a hyperlink to teletrade.org. Automatic import of materials and information from this website is prohibited.
Please contact our PR department if you have any questions or need assistance at pr@teletrade.global.
transfers