- Analytics
- News and Tools
- Market News
- Gold Price Forecast: XAU/USD struggles to surpass $1,950, upside seems favored as US debt dynamics modify
Gold Price Forecast: XAU/USD struggles to surpass $1,950, upside seems favored as US debt dynamics modify
- Gold price is facing delicate hurdles around $1,945.00 despite the USD Index has retreated from 104.20.
- A downgrade in the US long-term credibility would have a negative impact on the USD Index and US equities.
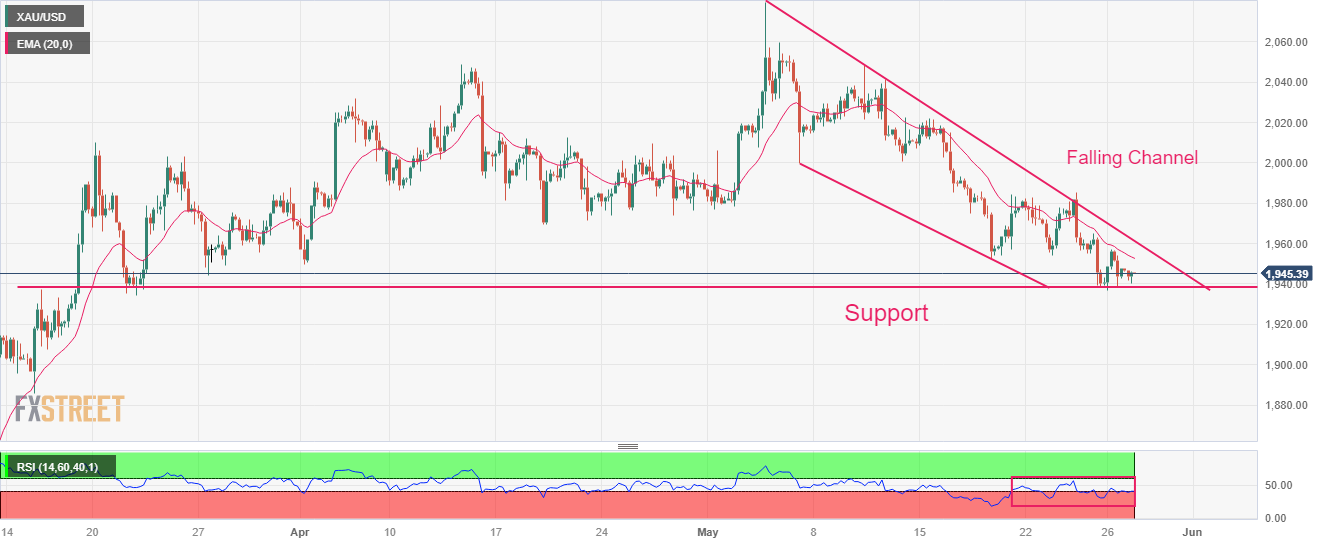
- Gold price is defending its cushion near horizontal support plotted from $1.937.39.
Gold price (XAU/USD) is facing fragile barricades around $1,945.00 in the Asian session. The precious metal is expected to move higher as the US Dollar Index (DXY) has retreated after a pullback move to near 104.20. The approval of a raise in the US debt-ceiling has pushed the USD index under pressure.
There is no denying the fact that the United States economy will attract a downgrade in its long-term credibility by credit rating agencies as higher debt increases the default chances of a nation. This would have a negative impact on the US Dollar Index and US equities, however, Gold would be considered a safe-haven. Therefore, the upside bias for the Gold price looks extremely solid.
S&P500 futures have surrendered the majority of gains added in early Asia. Investors should note that US markets are closed on Monday on account of Memorial Day, therefore, investors could remain risk-averse ahead.
Meanwhile, fears of more interest rate hikes by the Federal Reserve (Fed) could put some pressure on the Gold price. Rising consumer spending is advocating persistence in the US inflation, which could force the Fed not to halt its policy-tightening spell. This week, the US Employment data will keep investors’ busy as it will provide a base for June’s monetary policy meeting.
Gold technical analysis
Gold price is defending its cushion near horizontal support plotted from March 15 high at $1.937.39 on a four-hour scale. The precious metal is auctioning in a Falling Channel in which each pullback is considered a selling opportunity by market participants.
The 20-period Exponential Moving Average (EMA) at $1,952.38 is consistently barricading the Gold bulls from making any recovery.
Meanwhile, the Relative Strength Index (RSI) (14) is looking to shift its oscillation in the 40.00-60.00 range from the bearish range of 20.00-40.00, which indicates that the downside momentum has faded.
Gold four-hour chart


© 2000-2026. All rights reserved.
This site is managed by Teletrade D.J. LLC 2351 LLC 2022 (Euro House, Richmond Hill Road, Kingstown, VC0100, St. Vincent and the Grenadines).
The information on this website is for informational purposes only and does not constitute any investment advice.
The company does not serve or provide services to customers who are residents of the US, Canada, Iran, The Democratic People's Republic of Korea, Yemen and FATF blacklisted countries.
Making transactions on financial markets with marginal financial instruments opens up wide possibilities and allows investors who are willing to take risks to earn high profits, carrying a potentially high risk of losses at the same time. Therefore you should responsibly approach the issue of choosing the appropriate investment strategy, taking the available resources into account, before starting trading.
Use of the information: full or partial use of materials from this website must always be referenced to TeleTrade as the source of information. Use of the materials on the Internet must be accompanied by a hyperlink to teletrade.org. Automatic import of materials and information from this website is prohibited.
Please contact our PR department if you have any questions or need assistance at pr@teletrade.global.
transfers