- Analytics
- News and Tools
- Market News
- US equities wobble as investors brace for the Fed, S&P 500 back below $4,450
US equities wobble as investors brace for the Fed, S&P 500 back below $4,450
- US equities trade tightly, fall back into recent ranges as Fed looms large.
- The Federal Reserve is set to keep rates steady for this meeting.
- FOMC to release their latest inflation expectations looking forward.
It’s all eyes on the Federal Reserve (Fed) for this week as the latest interest rate call on Wednesday from the Fed hangs over the markets. US equities were broadly back, albeit softly, and indexes spread towards the middle as investors brace for an updated playbook from the Federal Open Market Committee (FOMC).
The Standard & Poor’s 500 (S&P) slipped ten points to give up the $4,450.00 handle, settling the day down near $4,430.00 (-0.22%); The NASDAQ tech composite index declined 32 points to end the day near $13,678.00 (-0.23%); and the Dow Jones Industrial Average (DJIA) slid over 105 points to end Tuesday at $34,517.00 (-0.31%).
Stocks down, yields up ahead of Fed
As equity indexes backslid, treasury yields climbed again, with the 2-year note rising to 5.092 and the 10-year lifting to 1.365.
Wednesday will see the latest interest rate call from the Fed, where markets are broadly anticipating the US central bank to hold steady on their benchmark rates.
However, the FOMC will also be dropping its economic projections as well as its updated interest rate outlook. The data docket will be followed by the FOMC’s press conference 30 minutes later where investors will be keeping a close eye out for any changes in the Fed’s rhetoric stance.
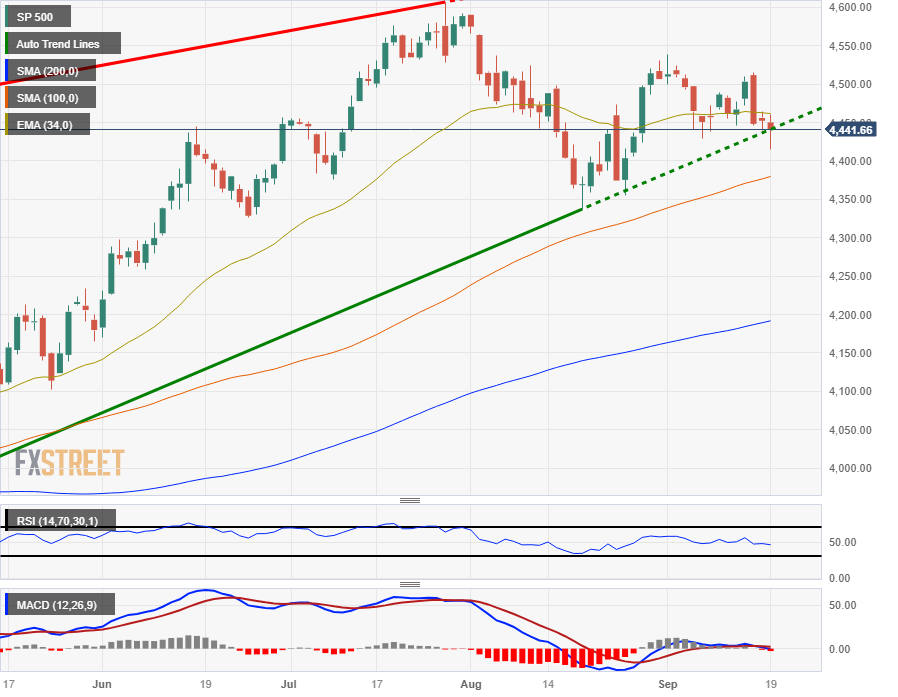
S&P 500 technical outlook
Daily candlesticks have the major equity index firmly testing the bounds of a rising trendline, and an extended bearish slide could see the S&P kick into a further leg down to test the last swing low below $4,350.00.
Bullish momentum sees descending resistance from the upside as lower highs price in a ceiling north of the $4,500.00 handle.
The 100-day Simple Moving Average is on the rise, clearing $4,375.00 and could provide support for renewed bullish momentum in the index looking forward.
S&P 500 daily chart
S&P 500 technical levels


© 2000-2026. All rights reserved.
This site is managed by Teletrade D.J. LLC 2351 LLC 2022 (Euro House, Richmond Hill Road, Kingstown, VC0100, St. Vincent and the Grenadines).
The information on this website is for informational purposes only and does not constitute any investment advice.
The company does not serve or provide services to customers who are residents of the US, Canada, Iran, The Democratic People's Republic of Korea, Yemen and FATF blacklisted countries.
Making transactions on financial markets with marginal financial instruments opens up wide possibilities and allows investors who are willing to take risks to earn high profits, carrying a potentially high risk of losses at the same time. Therefore you should responsibly approach the issue of choosing the appropriate investment strategy, taking the available resources into account, before starting trading.
Use of the information: full or partial use of materials from this website must always be referenced to TeleTrade as the source of information. Use of the materials on the Internet must be accompanied by a hyperlink to teletrade.org. Automatic import of materials and information from this website is prohibited.
Please contact our PR department if you have any questions or need assistance at pr@teletrade.global.
transfers