- Analytics
- News and Tools
- Market News
- US equities catch a ride up on Monday, S&P 500 taps $4,380
US equities catch a ride up on Monday, S&P 500 taps $4,380
- US stock indexes caught some lift on Monday, rising on improving risk appetite.
- US earnings season is underway, and investors are looking for solid expectation beats.
- Stock traders are looking for an extended rebound in stock prices.
The Standard & Poor's (S&P) 500 major equity index rose over 1% on Monday, gaining 45 points to close at $4,373.63. Other major US indexes faired equally well, with the Dow Jones Industrial Average (DJIA) rising 0.93%, climbing almost 315 points to close at $33,984.54. The NASDAQ Composite index also gained 1.2%, lifting 160.75 points to end Monday at $13,567.98.
Wall Street is looking ahead with hopes of broad beats with over 50 companies, or 11% of the S&P index reporting summer profits this week. Investors will be looking for signs that growth in the US economy is firming up, and notable earnings reports this week include Bank of America, Tesla, Netflix, and Johnson & Johnson.
Markets have broadly shrugged off last week's risk-off flows sparked by the latest escalation of the Israel-Hammas conflict, though tensions around the Middle East remain in the undercurrent, with energies struggling to shake off concerns about geopolitical tensions threatening the safety and relative calm of the Strait of Hormuz. Nearly a fifth of all global fossil fuel trade passes through the chokepoint, and a ramping up of tensions in the region could see global trade stifled.
S&P 500 Technical Outlook
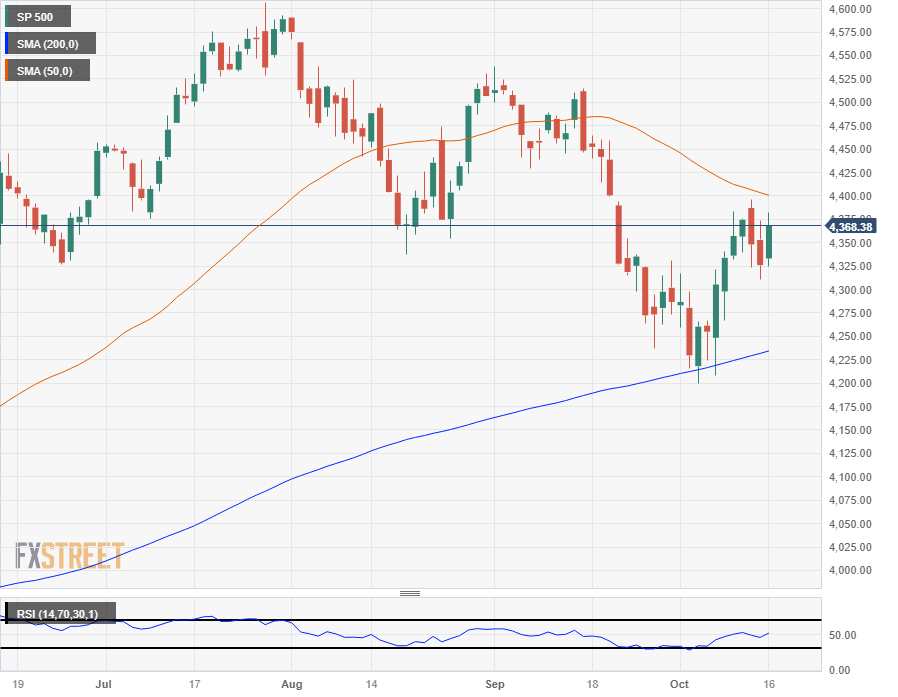
The S&P 500's Monday rebound takes the index into $4,370 to close out the day after marking in an intraday high of $4,381. Monday's recovery sees the major equity index back into the green, but still down from Thursday's peak near $4,396.
Current price action is set to see technical resistance coming from the 50-day Simple Moving Average (SMA) which is testing into the $4,400 major handle, but long-term prospects appear to remain bullish after the S&P decisive rebound from the 200-day SMA near $4,225 in early October.
S&P 500 Daily Chart
S&P 500 Technical Levels


© 2000-2026. All rights reserved.
This site is managed by Teletrade D.J. LLC 2351 LLC 2022 (Euro House, Richmond Hill Road, Kingstown, VC0100, St. Vincent and the Grenadines).
The information on this website is for informational purposes only and does not constitute any investment advice.
The company does not serve or provide services to customers who are residents of the US, Canada, Iran, The Democratic People's Republic of Korea, Yemen and FATF blacklisted countries.
Making transactions on financial markets with marginal financial instruments opens up wide possibilities and allows investors who are willing to take risks to earn high profits, carrying a potentially high risk of losses at the same time. Therefore you should responsibly approach the issue of choosing the appropriate investment strategy, taking the available resources into account, before starting trading.
Use of the information: full or partial use of materials from this website must always be referenced to TeleTrade as the source of information. Use of the materials on the Internet must be accompanied by a hyperlink to teletrade.org. Automatic import of materials and information from this website is prohibited.
Please contact our PR department if you have any questions or need assistance at pr@teletrade.global.
transfers