- Analytics
- News and Tools
- Market News
- NZD/JPY Price Analysis: Kiwi the biggest mover on Thursday, climbs 0.46% against the Yen
NZD/JPY Price Analysis: Kiwi the biggest mover on Thursday, climbs 0.46% against the Yen
- The Kiwi has earned the dubious title of Thursday’s largest market mover.
- The NZD/JPY cleared almost half a percent in otherwise flat trading.
- Price action still capped underneath last week’s eight-year peak of 91.20.
The NZD/JPY rolled up almost half a percent on Thursday as the Kiwi (NZD) sees a continuation of its climb up and over the Japanese Yen (JPY). The pair has closed in the green for three consecutive trading days and has pared back half of its losses after tumbling last week from an eight-year high of 91.20.
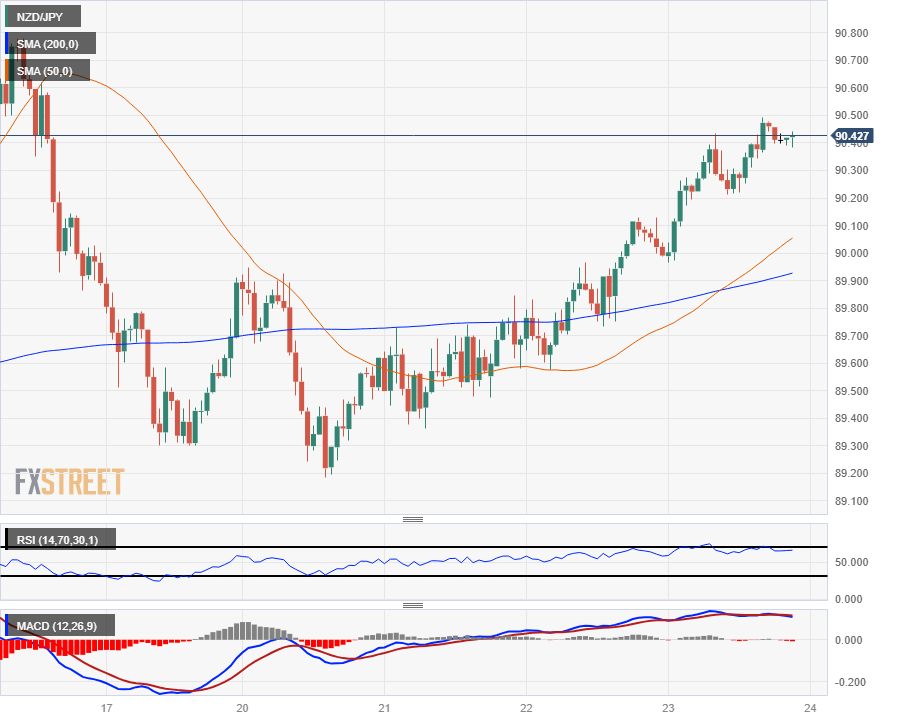
Hourly candles see the NZD/JPY trading bullish after catching a technical reversal from constrained 50- and 200-hour Simple Moving Averages (SMA) giving way to a bullish crossover.
The pair is now catching technical support from the 200-hour SMA lifting above 89.90 while the 50-hour SMA provides near-term support above the major 90.00 handle.
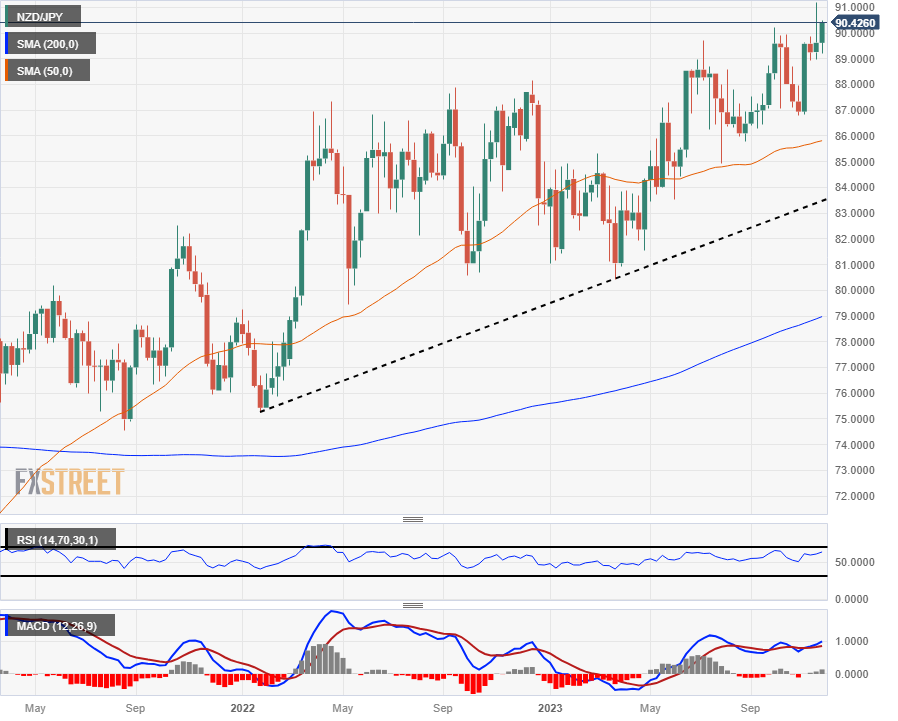
Weekly candlesticks tell an incredibly bullishly overbought story, with the NZD/JPY trading into eight-year highs as the Kiwi attempts to take a run at 92.00, a level the pair hasn’t seen since April of 2015.
New Zealand Dollar price today
The table below shows the percentage change of New Zealand Dollar (NZD) against listed major currencies today. New Zealand Dollar was the strongest against the Japanese Yen.
| USD | EUR | GBP | CAD | AUD | JPY | NZD | CHF | |
| USD | -0.16% | -0.37% | 0.04% | -0.24% | 0.05% | -0.44% | 0.03% | |
| EUR | 0.17% | -0.20% | 0.20% | -0.09% | 0.21% | -0.27% | 0.20% | |
| GBP | 0.35% | 0.19% | 0.39% | 0.11% | 0.41% | -0.08% | 0.39% | |
| CAD | -0.04% | -0.20% | -0.40% | -0.28% | 0.02% | -0.47% | -0.01% | |
| AUD | 0.26% | 0.07% | -0.13% | 0.27% | 0.29% | -0.20% | 0.26% | |
| JPY | -0.05% | -0.23% | -0.41% | -0.01% | -0.29% | -0.49% | -0.03% | |
| NZD | 0.43% | 0.27% | 0.08% | 0.46% | 0.20% | 0.49% | 0.47% | |
| CHF | -0.03% | -0.20% | -0.39% | 0.01% | -0.28% | 0.02% | -0.47% |
The heat map shows percentage changes of major currencies against each other. The base currency is picked from the left column, while the quote currency is picked from the top row. For example, if you pick the Euro from the left column and move along the horizontal line to the Japanese Yen, the percentage change displayed in the box will represent EUR (base)/JPY (quote).
NZD/JPY Hourly Chart
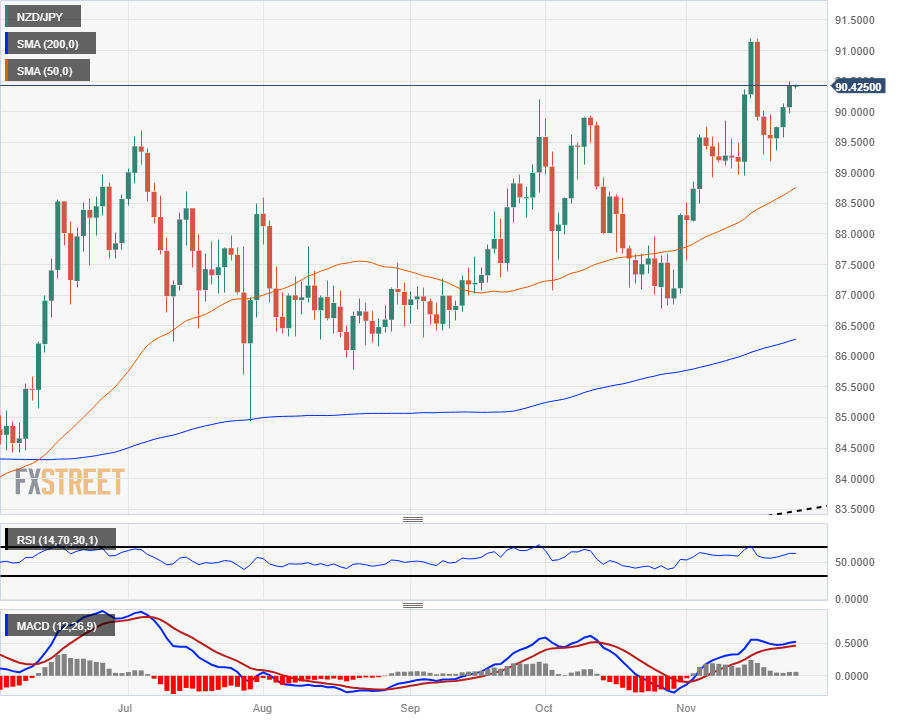
NZD/JPY Daily Chart
NZD/JPY Weekly Chart


© 2000-2026. All rights reserved.
This site is managed by Teletrade D.J. LLC 2351 LLC 2022 (Euro House, Richmond Hill Road, Kingstown, VC0100, St. Vincent and the Grenadines).
The information on this website is for informational purposes only and does not constitute any investment advice.
The company does not serve or provide services to customers who are residents of the US, Canada, Iran, The Democratic People's Republic of Korea, Yemen and FATF blacklisted countries.
Making transactions on financial markets with marginal financial instruments opens up wide possibilities and allows investors who are willing to take risks to earn high profits, carrying a potentially high risk of losses at the same time. Therefore you should responsibly approach the issue of choosing the appropriate investment strategy, taking the available resources into account, before starting trading.
Use of the information: full or partial use of materials from this website must always be referenced to TeleTrade as the source of information. Use of the materials on the Internet must be accompanied by a hyperlink to teletrade.org. Automatic import of materials and information from this website is prohibited.
Please contact our PR department if you have any questions or need assistance at pr@teletrade.global.
transfers