- Analytics
- News and Tools
- Market News
- NZD/JPY consolidates gains, diverging RBNZ and BoJ policies stir movements
NZD/JPY consolidates gains, diverging RBNZ and BoJ policies stir movements
- The NZD/JPY trades at 91.567, recording 0.23% losses in Monday's session.
- The RBNZ is expected to continue hiking, leading to a terminal rate of 6% by April.
- Markets are betting on a BoJ liftoff by June.
In Monday's session, the NZD/JPY declined to 91.55 with a slight downtrend of 0.23%. As market participants anticipate diverging strategies between the Reserve Bank of New Zealand (RBNZ) and Bank of Japan (BoJ), NZD/JPY the Kiwi is set for further strengthening as the downside could be explained by investors taking profits and consolidating gains.
The RBNZ Governor Orr appeared before a parliamentary committee and maintained a hawkish stance, signaling that steady inflation at 4.7% YoY is still above the 2% target and hinting that additional tightening may be appropriate. As for now, the odds of a February hike stand at 33% and rose to 65% by May.
In addition, as the New Zealand economic climate remains robust, fueling expectations of a more aggressive central bank policy, the slow economic growth and low inflation in Japan could push BoJ towards further easing and delay a lift until June weakening the pair. Key economic indicators and policy announcements from both banks will likely shape the NZD/JPY pair's dynamics substantially, with market participants eyeing upcoming RBNZ and BoJ meetings.
NZD/JPY technical analysis
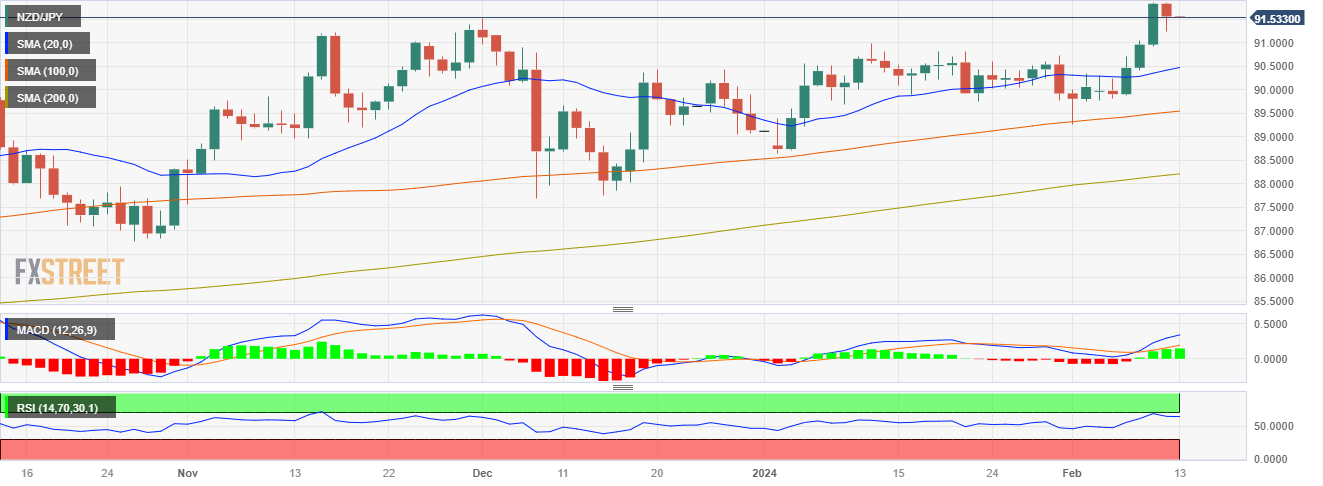
The daily chart's Relative Strength Index (RSI) stands in positive territory, marking descending from overbought regions, aligning with a bullish perspective. This downward slope suggests a slight weakening in buying momentum as buyers take profits and consolidate gains. The Moving Average Convergence Divergence (MACD) histogram prints green bars, indicating that buyers are maintaining control over the market direction.
In contrast, the hourly RSI paints a slightly negative territory, as it fell to near its 50 middle points while the hourly MACD histogram, on the other hand, prints declining green bars, indicating a building negative momentum.
Considering the juxtaposition of daily and hourly dynamics, it seems likely that the NZD/JPY pair is following a temporary pullback within a broader bullish trend as it sits above the 20,100,200-day Simple Moving Average (SMA). This suggests a possible dominance of buyers in the larger time frame, despite short-term selling pressure.
NZD/JPY daily chart


© 2000-2026. All rights reserved.
This site is managed by Teletrade D.J. LLC 2351 LLC 2022 (Euro House, Richmond Hill Road, Kingstown, VC0100, St. Vincent and the Grenadines).
The information on this website is for informational purposes only and does not constitute any investment advice.
The company does not serve or provide services to customers who are residents of the US, Canada, Iran, The Democratic People's Republic of Korea, Yemen and FATF blacklisted countries.
Making transactions on financial markets with marginal financial instruments opens up wide possibilities and allows investors who are willing to take risks to earn high profits, carrying a potentially high risk of losses at the same time. Therefore you should responsibly approach the issue of choosing the appropriate investment strategy, taking the available resources into account, before starting trading.
Use of the information: full or partial use of materials from this website must always be referenced to TeleTrade as the source of information. Use of the materials on the Internet must be accompanied by a hyperlink to teletrade.org. Automatic import of materials and information from this website is prohibited.
Please contact our PR department if you have any questions or need assistance at pr@teletrade.global.
transfers