- Analytics
- News and Tools
- Market News
- USD/JPY Price Analysis: Extends downside to 150.00 as USD Index drops to weekly low
USD/JPY Price Analysis: Extends downside to 150.00 as USD Index drops to weekly low
- USD/JPY falls to near 150.00 amid a sell-off in the USD Index.
- Fed policymakers warned that over-focusing on a one-time inflation increase could be a tremendous mistake.
- The BoJ may postpone plans of exiting the expansionary monetary policy stance.
The USD/JPY pair falls slightly below the psychological support of 150.00 in the early New York session on Tuesday. The asset has faced selling pressure as the US Dollar Index (DXY) has extended its downside to 104.00.
The USD Index has dropped to a weekly low as Federal Reserve (Fed) policymakers are confident that inflation is in the right direction despite a one-time stubborn-than-anticipated consumer price inflation data for January.
Fed policymakers advised that over-focusing on one-time blips in inflation data could be a tremendous mistake. As per the CME FedWatch tool, investors see interest rates remaining unchanged in the range of 5.25%-5.50% till the July policy meeting as the Fed needs more good inflation data for months.
The Japanese Yen performs better against the US Dollar despite easing hopes for the Bank of Japan (BoJ) quitting the decade-long ultra-dovish monetary policy stance. The Japanese Yen entered a recession in the second half of 2023. The situation of a poor domestic economy is an unfavorable situation for exiting the expansionary policy stance.
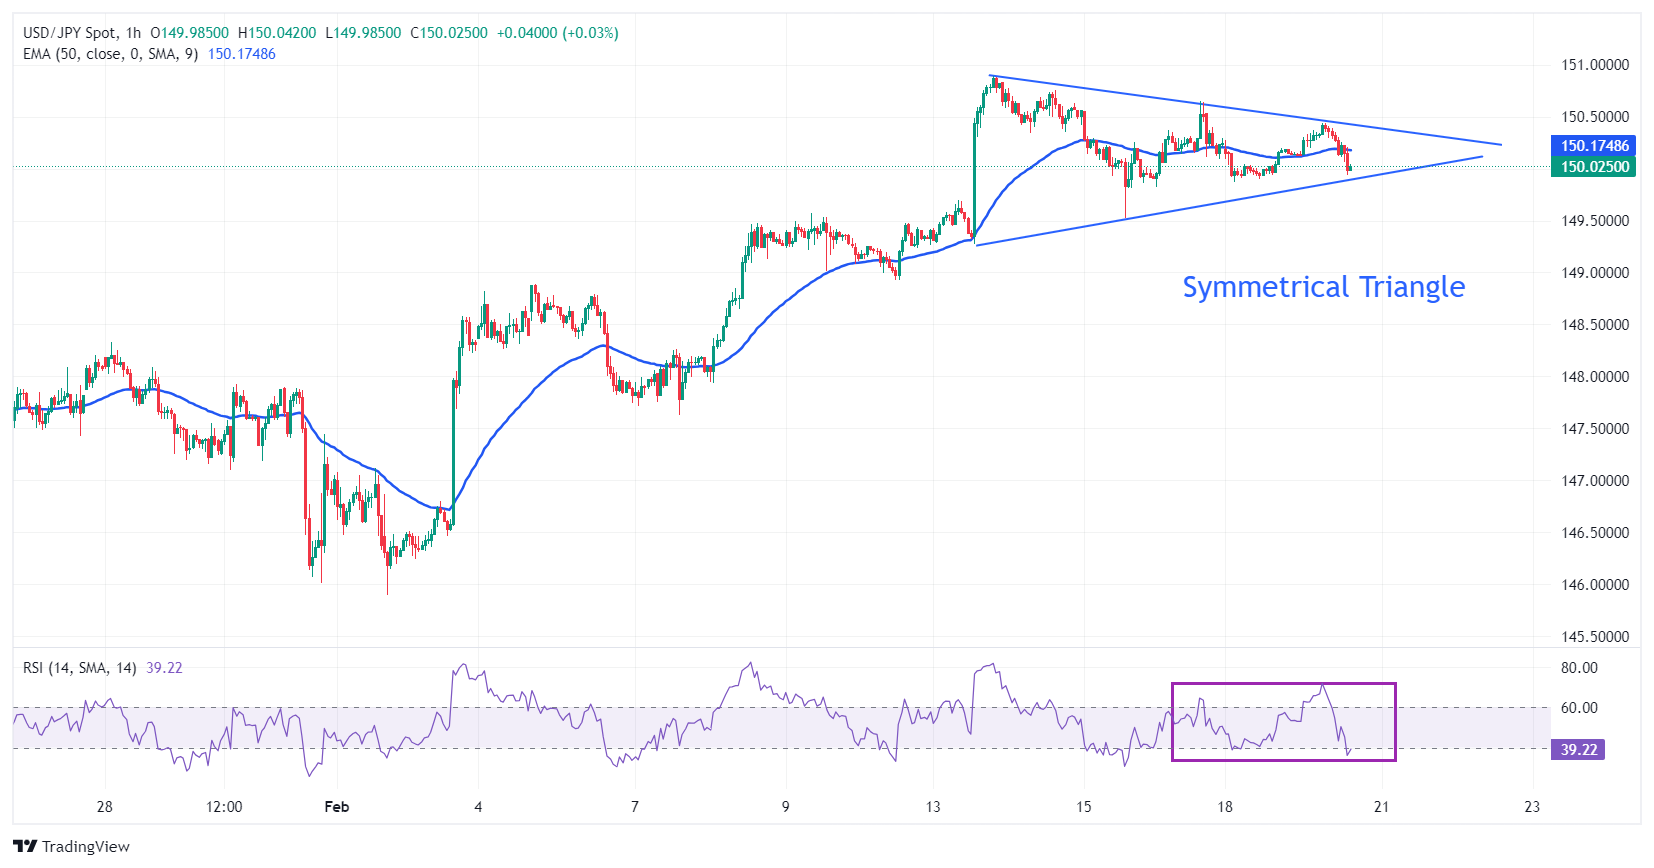
USD/JPY oscillates in a Symmetrical Triangle formation on an hourly time frame. The upward and downward-sloping borders of the aforementioned chart pattern are plotted from February 13 low and high at 149.27 and 150.88, respectively.
The triangle could breakout in either direction, however, the odds marginally favor a move in the direction of the trend before the formation of the triangle – in this case up.
The 50-period Exponential Moving Average (EMA) around 150.20 remains sticky to spot prices, indicates indecisiveness among market participants.
Going forward, a decisive break above February 13 high at 150.88 would drive the asset towards November 16 high at 151.43, followed by November 13 high at 151.90.
On the flip side, a breakdown below February 13 high at 149.27 would drag the asset towards February 5 high at 148.90. Breach of the latter would expose the asset to January 29 high at 148.32.
USD/JPY hourly chart


© 2000-2026. All rights reserved.
This site is managed by Teletrade D.J. LLC 2351 LLC 2022 (Euro House, Richmond Hill Road, Kingstown, VC0100, St. Vincent and the Grenadines).
The information on this website is for informational purposes only and does not constitute any investment advice.
The company does not serve or provide services to customers who are residents of the US, Canada, Iran, The Democratic People's Republic of Korea, Yemen and FATF blacklisted countries.
Making transactions on financial markets with marginal financial instruments opens up wide possibilities and allows investors who are willing to take risks to earn high profits, carrying a potentially high risk of losses at the same time. Therefore you should responsibly approach the issue of choosing the appropriate investment strategy, taking the available resources into account, before starting trading.
Use of the information: full or partial use of materials from this website must always be referenced to TeleTrade as the source of information. Use of the materials on the Internet must be accompanied by a hyperlink to teletrade.org. Automatic import of materials and information from this website is prohibited.
Please contact our PR department if you have any questions or need assistance at pr@teletrade.global.
transfers