- Analytics
- News and Tools
- Market News
- Silver Price Analysis: XAG/USD sticks to strong gains above $23.00, eyes 100-day SMA
Silver Price Analysis: XAG/USD sticks to strong gains above $23.00, eyes 100-day SMA
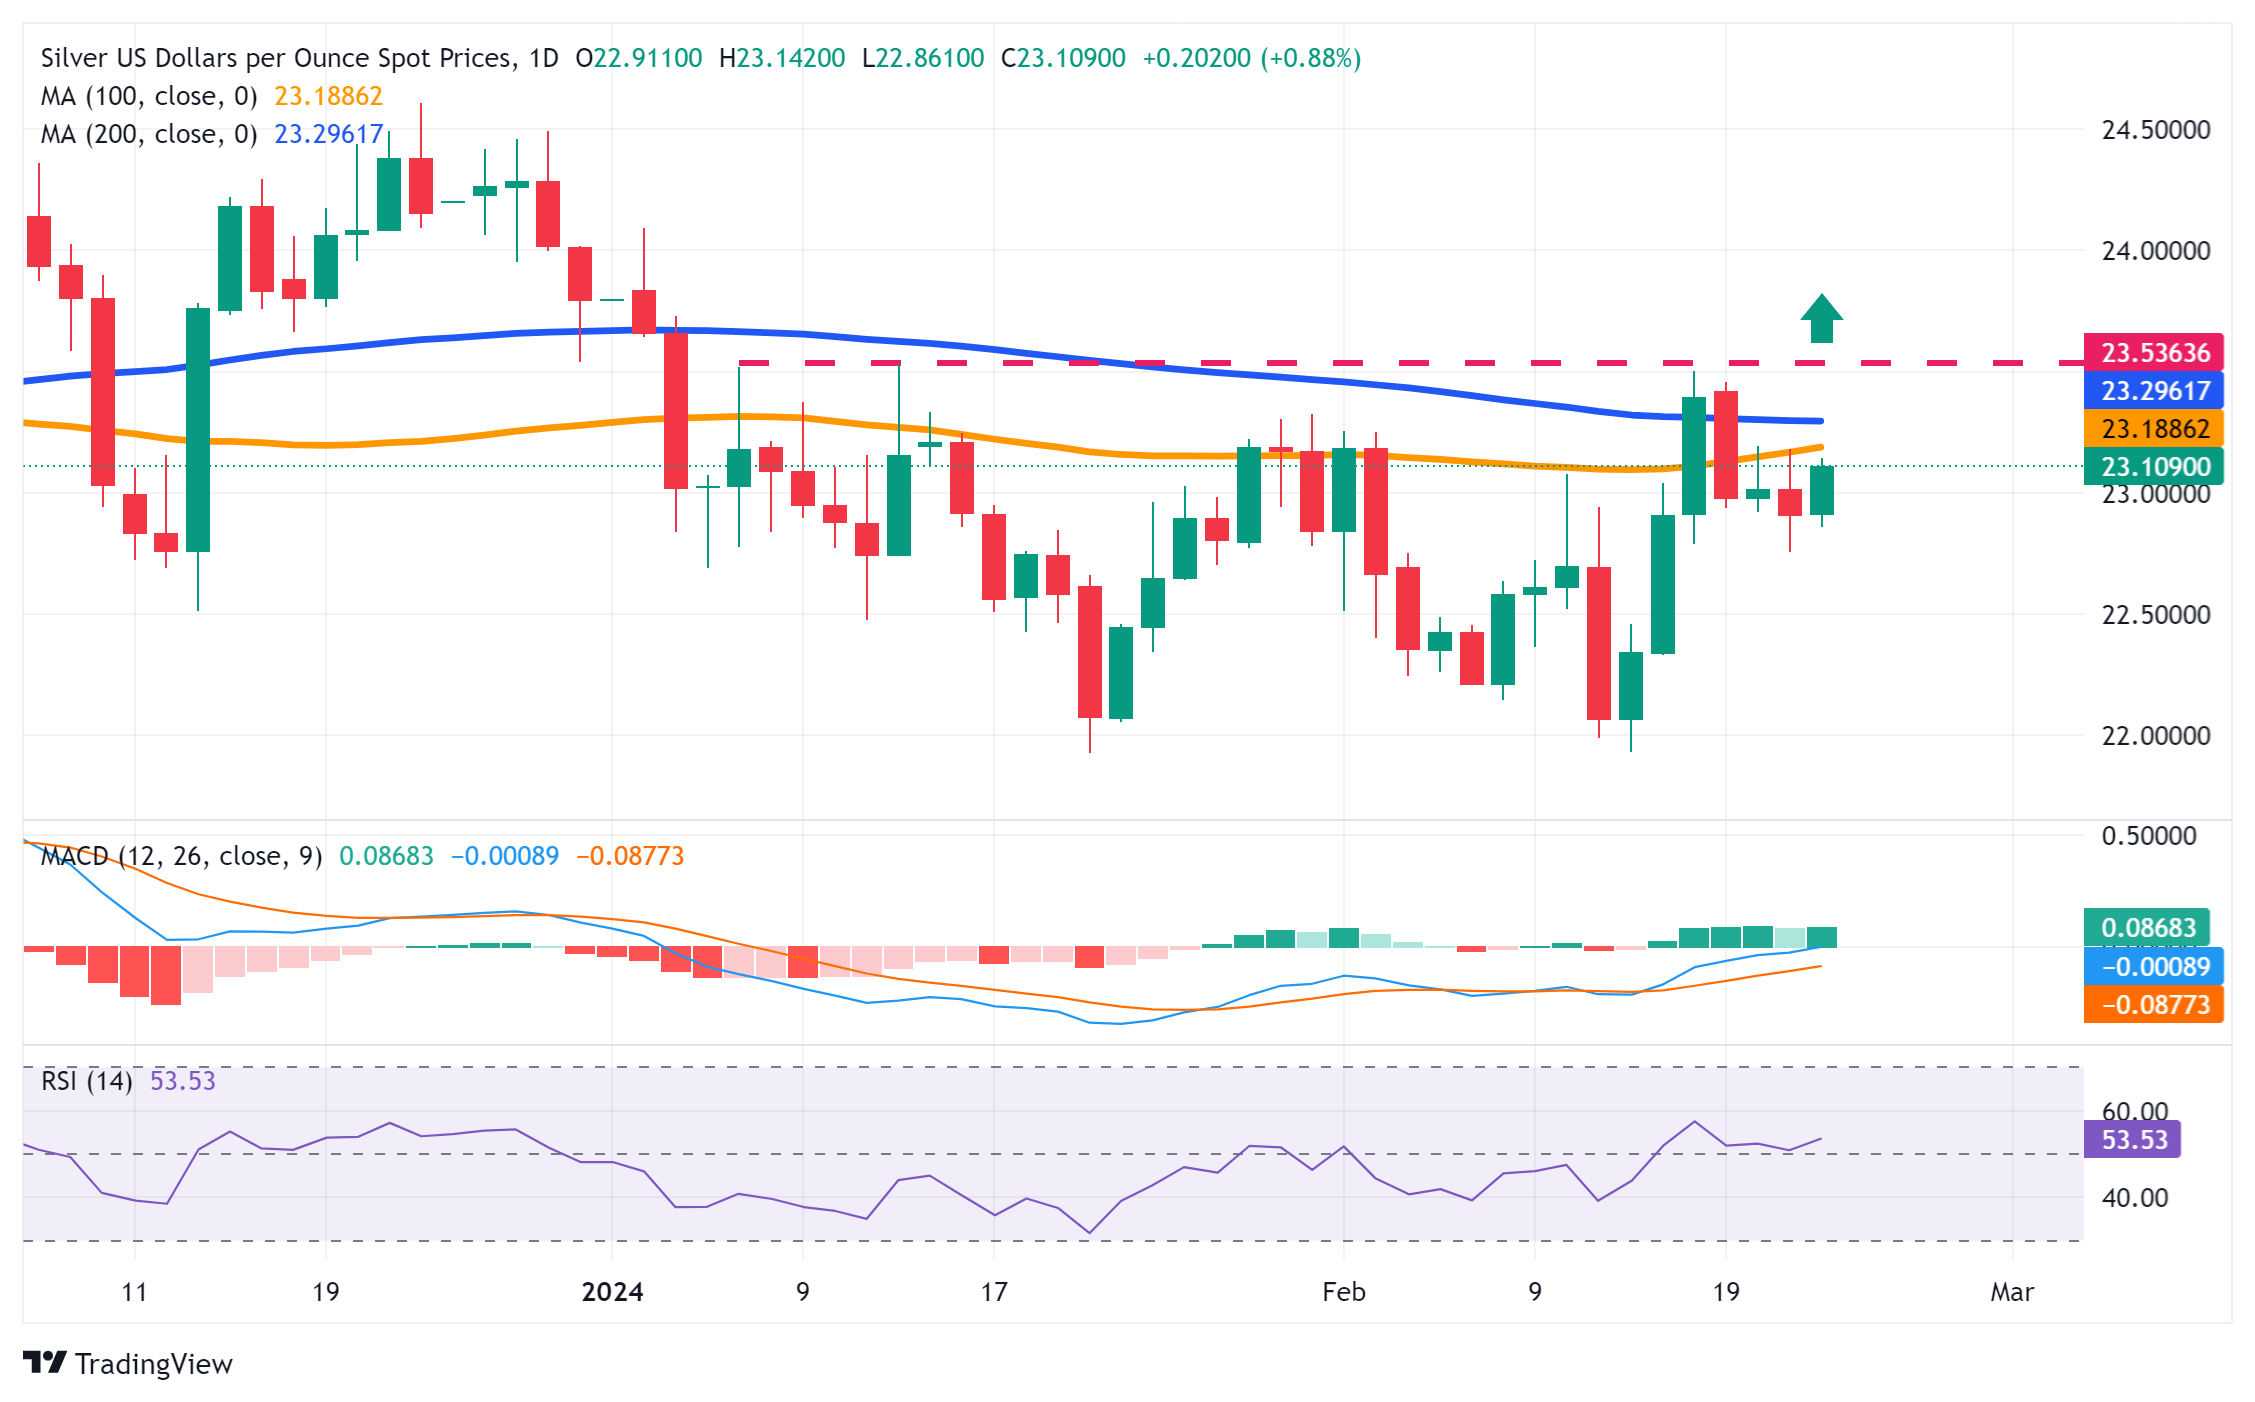
- Silver gains strong positive traction on Thursday and climbs back closer to the 100-day SMA barrier.
- The technical setup favours bullish traders and supports prospects for a further appreciating move.
- A sustained move and acceptance below $22.00 is needed to negate the near-term positive bias.
Silver (XAG/USD) builds on the overnight bounce from the 200-hour Simple Moving Average (SMA) support near the $22.75 area, or the weekly low and gains strong positive traction on Thursday. The momentum remains unabated through the first half of the European session and lifts the white metal to the $23.10-$23.15 region.
From a technical perspective, the XAG/USD is currently placed just below the 100-day SMA, which is closely followed by the very important 200-day SMA hurdle near the $23.30-$23.35 zone and the monthly peak, around mid-$23.00 touched last week. A sustained strength beyond the latter will be seen as a fresh trigger for bullish traders and pave the way for the resumption of last week's strong move up from sub-$22.00 levels.
Given that oscillators on the daily chart have just started gaining positive traction, the XAG/USD might then aim to reclaim the $24.00 round figure. The momentum could extend further and allow the white metal to climb towards the next relevant hurdle near the $24.50-$24.60 region en route to the $25.00 psychological mark.
On the flip side, the overnight swing low, around the $22.75 region, now seems to protect the immediate downside ahead of the mid-$22.00s and the $22.30 horizontal support. Some follow-through selling might expose the $22.00 mark. Acceptance below a two-month low, around the $21.90-$21.85 zone touched in January, will be seen as a fresh trigger for bearish traders and make the XAG/USD vulnerable to test the $21.40-$21.35 support.
The subsequent decline has the potential to drag the XAG/USD further below the $21.00 round-figure mark, towards retesting the October monthly swing low near the $20.70-$20.65 region.
Silver daily chart
Technical levels to watch


© 2000-2026. All rights reserved.
This site is managed by Teletrade D.J. LLC 2351 LLC 2022 (Euro House, Richmond Hill Road, Kingstown, VC0100, St. Vincent and the Grenadines).
The information on this website is for informational purposes only and does not constitute any investment advice.
The company does not serve or provide services to customers who are residents of the US, Canada, Iran, The Democratic People's Republic of Korea, Yemen and FATF blacklisted countries.
Making transactions on financial markets with marginal financial instruments opens up wide possibilities and allows investors who are willing to take risks to earn high profits, carrying a potentially high risk of losses at the same time. Therefore you should responsibly approach the issue of choosing the appropriate investment strategy, taking the available resources into account, before starting trading.
Use of the information: full or partial use of materials from this website must always be referenced to TeleTrade as the source of information. Use of the materials on the Internet must be accompanied by a hyperlink to teletrade.org. Automatic import of materials and information from this website is prohibited.
Please contact our PR department if you have any questions or need assistance at pr@teletrade.global.
transfers