- Analytics
- News and Tools
- Market News
- AUD/JPY Price Analysis: Buyers hold sway with hints of increasing sell-off, cross still in multi-year highs
AUD/JPY Price Analysis: Buyers hold sway with hints of increasing sell-off, cross still in multi-year highs
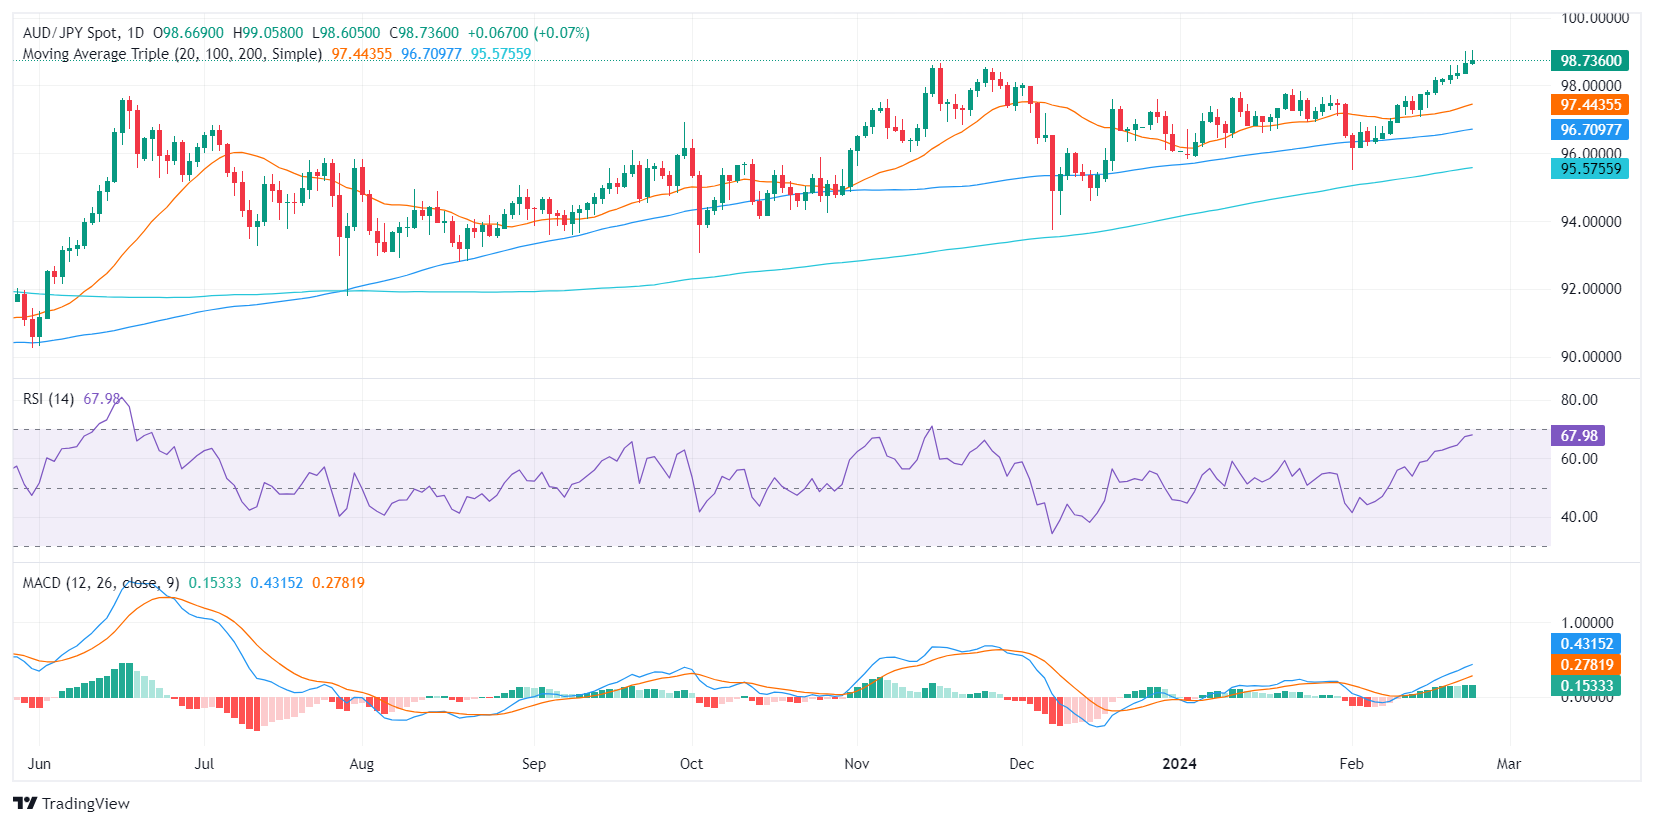
- The AUD/JPY is trading at 98.71, showing a slight gain during the Friday session still in highs since 2015.
- Daily RSI for the AUD/JPY suggests bullish momentum with a slight increase in the positive area.
- Divergences are observed between the hourly and daily charts where the latter signals buyers' dominance whilst the hourly chart indicates rising short-term selling pressure.
In Friday's session, the AUD/JPY pair is trading at 98.715, reflecting a slight increase in buying pressure. The daily chart signals that the buyers are in control but that bears are starting to wake up, while in the hourly chart, the consolidation is more evident with indicators losing ground.
On the daily chart, the Relative Strength Index (RSI) pair shows a positive stance, signifying the dominance of buyers. This can be inferred from RSI territory, which consistently remains positive, despite a marginal downtrend observed within the positive territory. This suggests a slight increase in selling pressure, however, buyers continue to hold dominance given the RSI's positive territory position.
Concurrent with this, the daily Moving Average Convergence Divergence (MACD) is exhibiting flat green bars. This indicates that the momentum of the market is neutral on the surface, yet further scrutiny reveals that buyers hold the upper hand as the pair lingers above the 20, 100, and 200-day Simple Moving Averages (SMAs).
AUD/JPY daily chart
Upon examining the hourly chart, the RSI's position has diverted into negative territory while the MACD presents rising red bars suggesting a surge in selling pressure in the short term, contrasting the positive bias observed in the daily chart.
AUD/JPY hourly chart
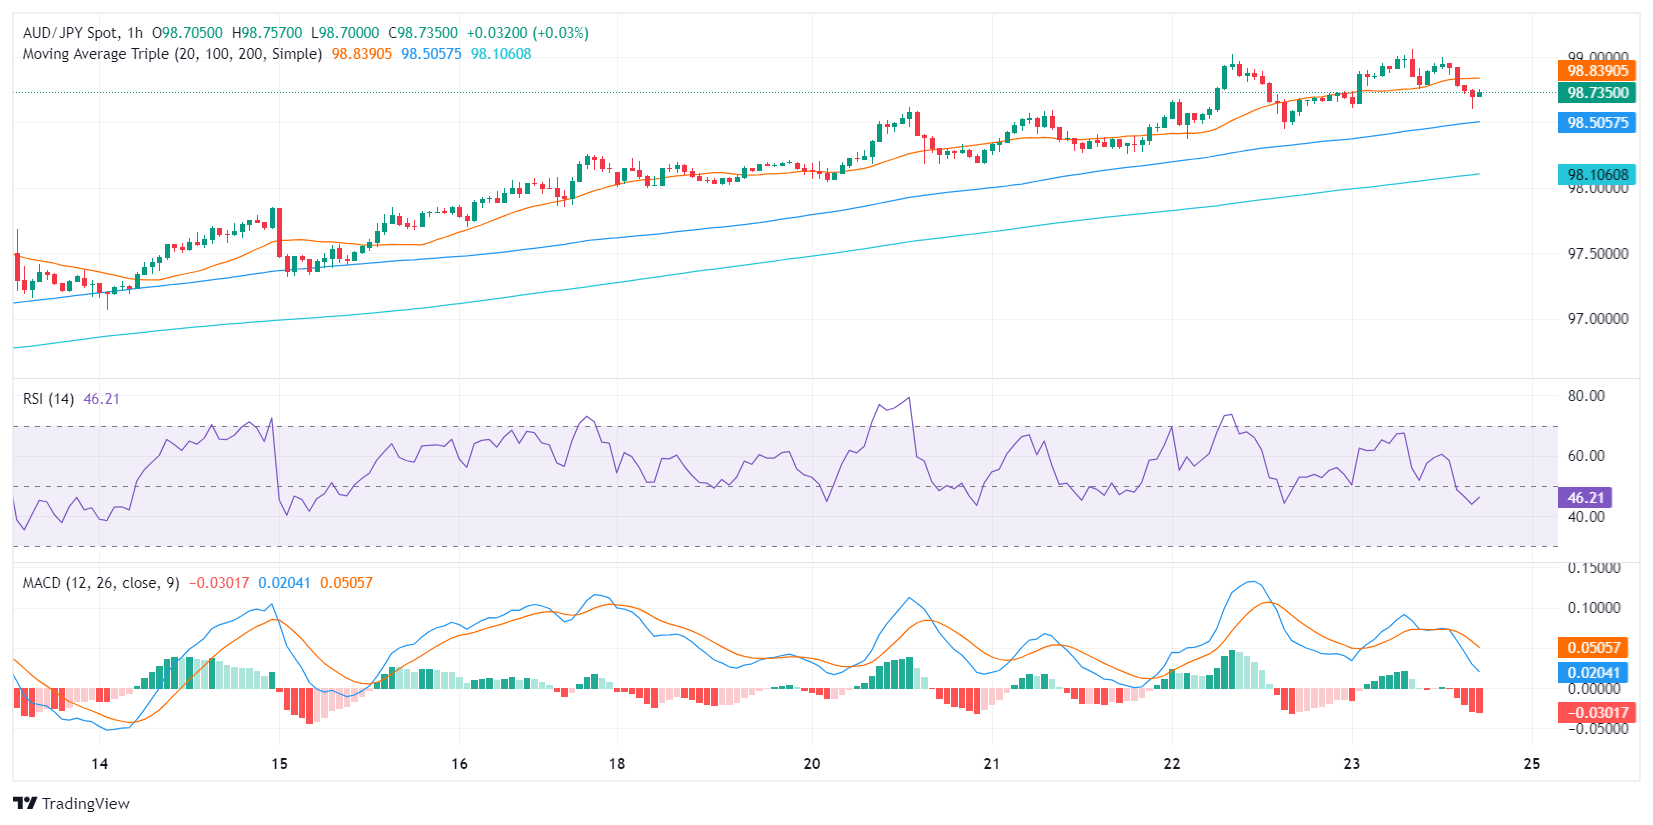
Conclusively, despite a short-term rise in selling pressure observed in the hourly chart, the longer-term daily chart suggests that buyers continue to control the market, fortified by the pair's position above the 20, 100, and 200-day SMAs.


© 2000-2026. All rights reserved.
This site is managed by Teletrade D.J. LLC 2351 LLC 2022 (Euro House, Richmond Hill Road, Kingstown, VC0100, St. Vincent and the Grenadines).
The information on this website is for informational purposes only and does not constitute any investment advice.
The company does not serve or provide services to customers who are residents of the US, Canada, Iran, The Democratic People's Republic of Korea, Yemen and FATF blacklisted countries.
Making transactions on financial markets with marginal financial instruments opens up wide possibilities and allows investors who are willing to take risks to earn high profits, carrying a potentially high risk of losses at the same time. Therefore you should responsibly approach the issue of choosing the appropriate investment strategy, taking the available resources into account, before starting trading.
Use of the information: full or partial use of materials from this website must always be referenced to TeleTrade as the source of information. Use of the materials on the Internet must be accompanied by a hyperlink to teletrade.org. Automatic import of materials and information from this website is prohibited.
Please contact our PR department if you have any questions or need assistance at pr@teletrade.global.
transfers