- Analytics
- News and Tools
- Market News
- USD/NOK regains some traction as the US economy holds strong
USD/NOK regains some traction as the US economy holds strong
- The USD/NOK is presently trading higher at 10.53, marking a 0.32% increase during Friday's session.
- The US Dollar stands firm as Fed officials show caution due to robust US economic indicators.
- Investors assess the likelihood of a Fed rate cut in March and May as low due to potential adverse implications on price stability.
- The USD is anticipated to see gains as the market adjusts its easing expectations and pushes the first rate cut from the Fed to June.
In Friday's trading session, the USD/NOK pair is trading at a level of 10.53, registering a modest gain of 0.32%. The US Dollar (USD) is showing a stable performance in light of Federal Reserve (Fed) officials adopting a cautious stance in light of a strong US economy. As a reaction, the probability of a rate cut in March and May by the Fed appears to be low according to the market’s expectations.
On the other hand, the short term of the NOK will be dictated on whether the Norges Bank will follow the Fed’s stance to delay cuts which will be guided by local data. In addition, the Norwegian currency gained momentum in 2024, due to rising Oil prices, as it is an important global producer, so in case, the black gold advances further the pair’s upside may be limited.
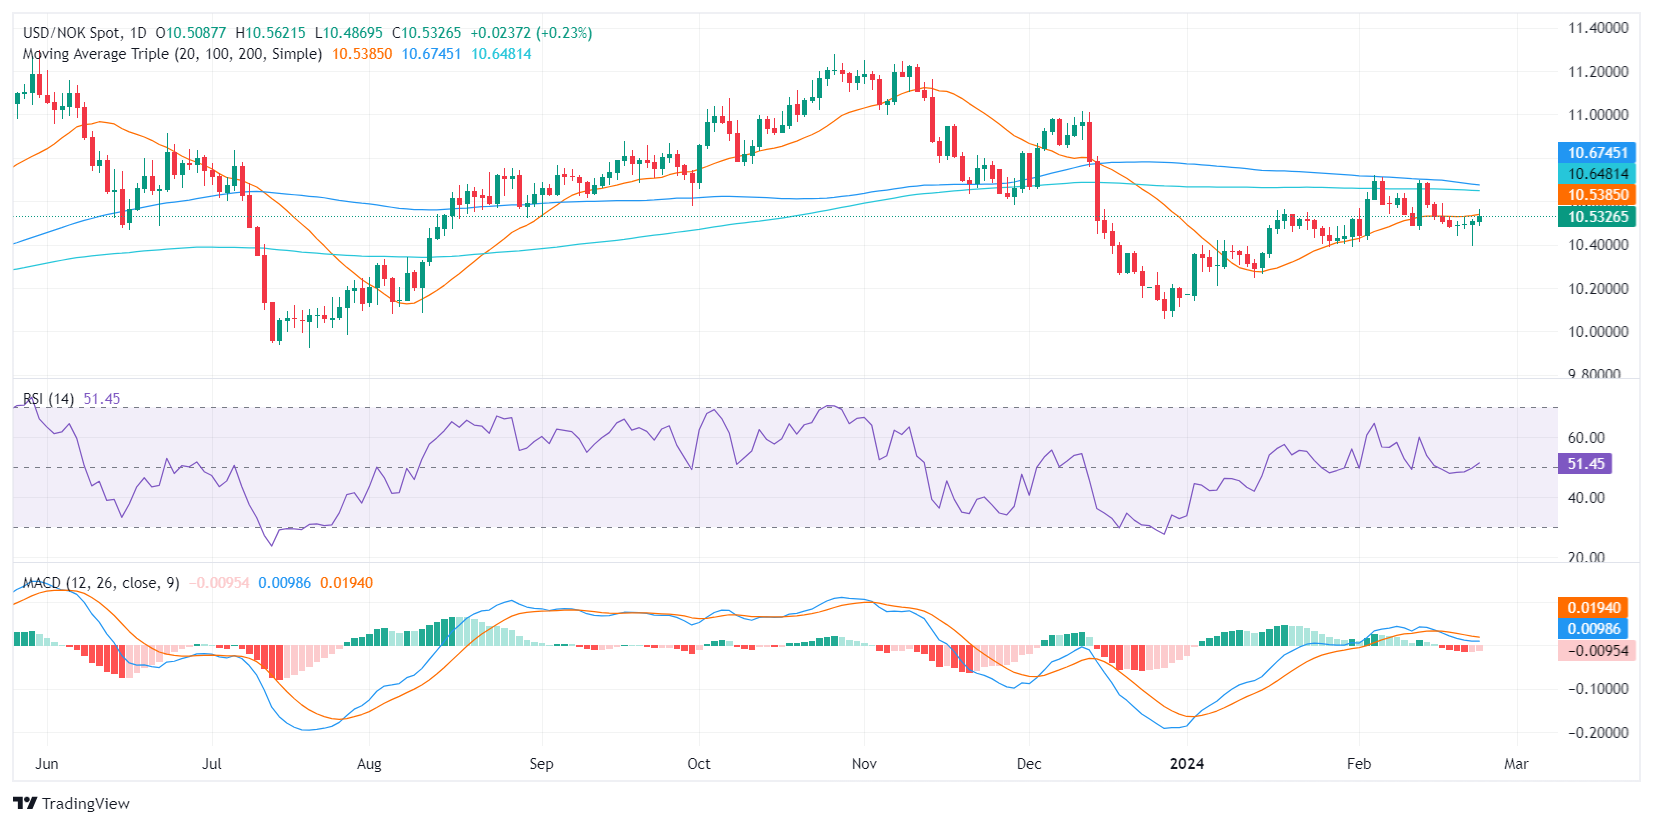
USD/NOK technical analysis
On the daily chart, the Relative Strength Index (RSI) for the USD/NOK is currently in positive territory. The upward slope indicates that buyers are beginning to assert control as the RSI readings moved from negative to positive region recently.
Comparatively, the RSI on the hourly chart shows similar signs of buyer dominance as the readings fall within the positive territory. This reaffirms the presence of the buying sentiment in both short and long-term perspective. Nonetheless, this perspective is somewhat dampened by the Moving Average Convergence Divergence (MACD). The MACD shows red bars in the hourly and daily chart, indicating negative momentum despite being flat. This indicates the presence of sellers in the market, putting a halt to the buying pressure as reflected by the RSI.
In the broader context, the pair is below its 20, 100, and 200-day Simple Moving Averages (SMAs) which is indicative of a controlled bear market. However, the underlined strengthening buyer dominance seen from the RSI might provide a reversal in trend if it maintains its consistency.
USD/NOK daily chart


© 2000-2026. All rights reserved.
This site is managed by Teletrade D.J. LLC 2351 LLC 2022 (Euro House, Richmond Hill Road, Kingstown, VC0100, St. Vincent and the Grenadines).
The information on this website is for informational purposes only and does not constitute any investment advice.
The company does not serve or provide services to customers who are residents of the US, Canada, Iran, The Democratic People's Republic of Korea, Yemen and FATF blacklisted countries.
Making transactions on financial markets with marginal financial instruments opens up wide possibilities and allows investors who are willing to take risks to earn high profits, carrying a potentially high risk of losses at the same time. Therefore you should responsibly approach the issue of choosing the appropriate investment strategy, taking the available resources into account, before starting trading.
Use of the information: full or partial use of materials from this website must always be referenced to TeleTrade as the source of information. Use of the materials on the Internet must be accompanied by a hyperlink to teletrade.org. Automatic import of materials and information from this website is prohibited.
Please contact our PR department if you have any questions or need assistance at pr@teletrade.global.
transfers