- Analytics
- News and Tools
- Market News
- AUD/JPY Price Analysis: Bears step in with hourly RSI near oversold area, trend still bullish
AUD/JPY Price Analysis: Bears step in with hourly RSI near oversold area, trend still bullish
- The AUD/JPY is currently trading at around 97.90, reflecting a decrease of 0.55% in Wednesday's session.
- Although the daily RSI MACD on the AUD/JPY hints at fading momentum, buyers continue establishing their upper hand.
- However, the hourly chart indicators suggest stronger selling activity with the RSI venturing into oversold regions.
In Wednesday's session, the AUD/JPY fell to around 97.90, losing 0.55%. The short-term technical outlook hints towards a shift in command from the bears to the bulls while the overall bullish trend remains positive.
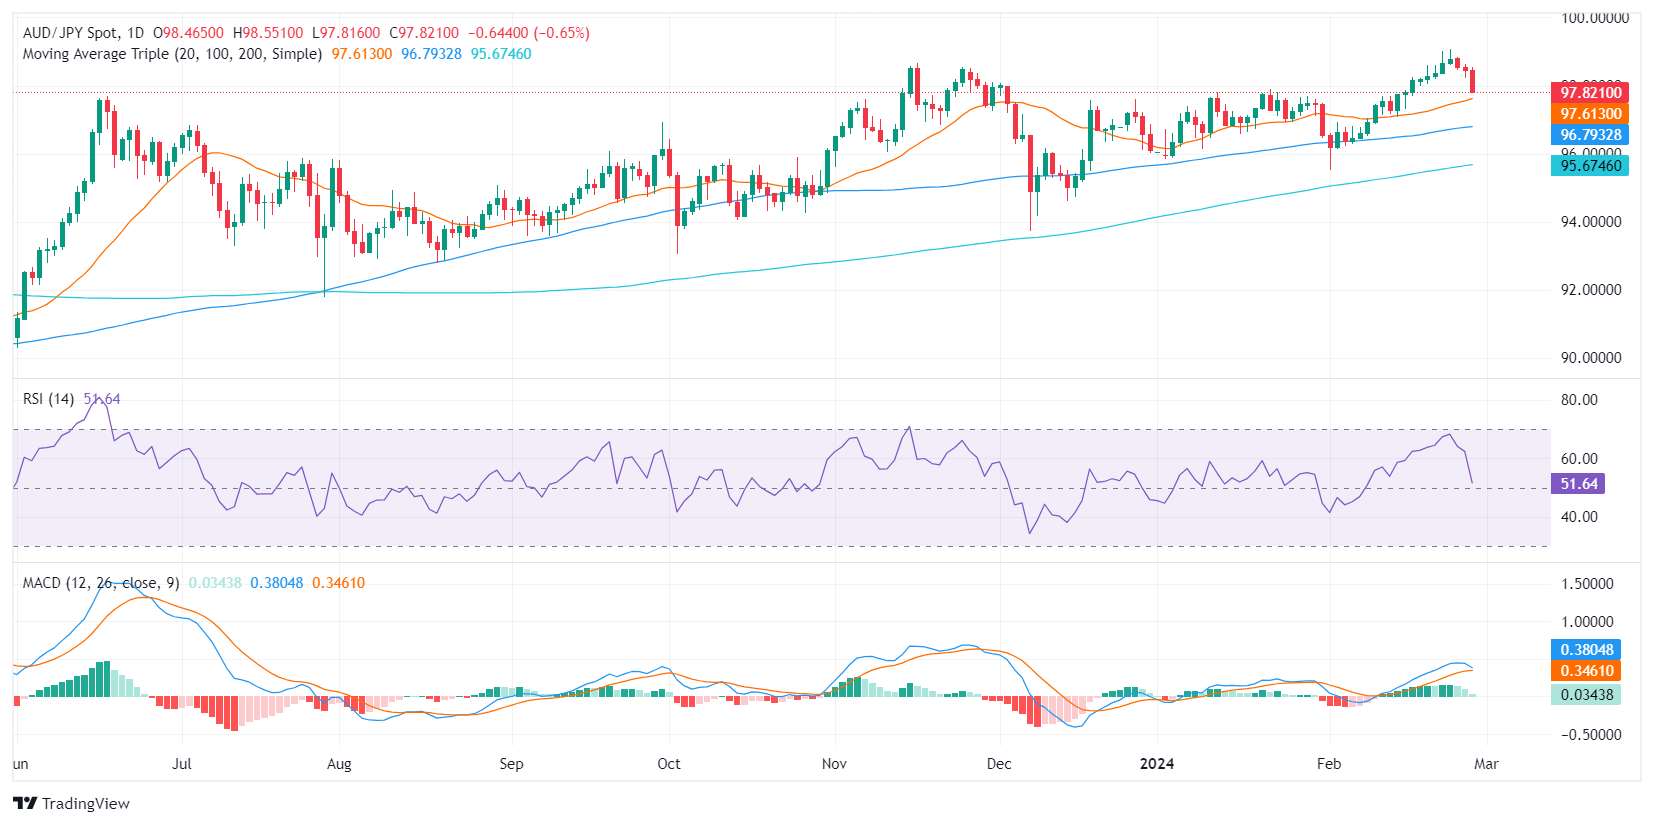
On the daily chart, the Relative Strength Index (RSI) for the AUD/JPY pair remains in positive territory, although with a declining trend. Despite the recent dip in the RSI, considering it still sits above the 50 mark, the buying pressure somewhat outweighs the selling pressure in the prevailing market conditions. However, a continuous downtrend, indicated by the RSI's negative slope since its recent peak, signifies a weakening in the buying momentum.
On the other hand, witnessing decreased green bars in the Moving Average Convergence Divergence (MACD) histogram indicates cues for a potential shift in trend. A falling MACD histogram generally means that the positive momentum is dwindling, indicating the sellers might be set to take control.
AUD/JPY daily chart
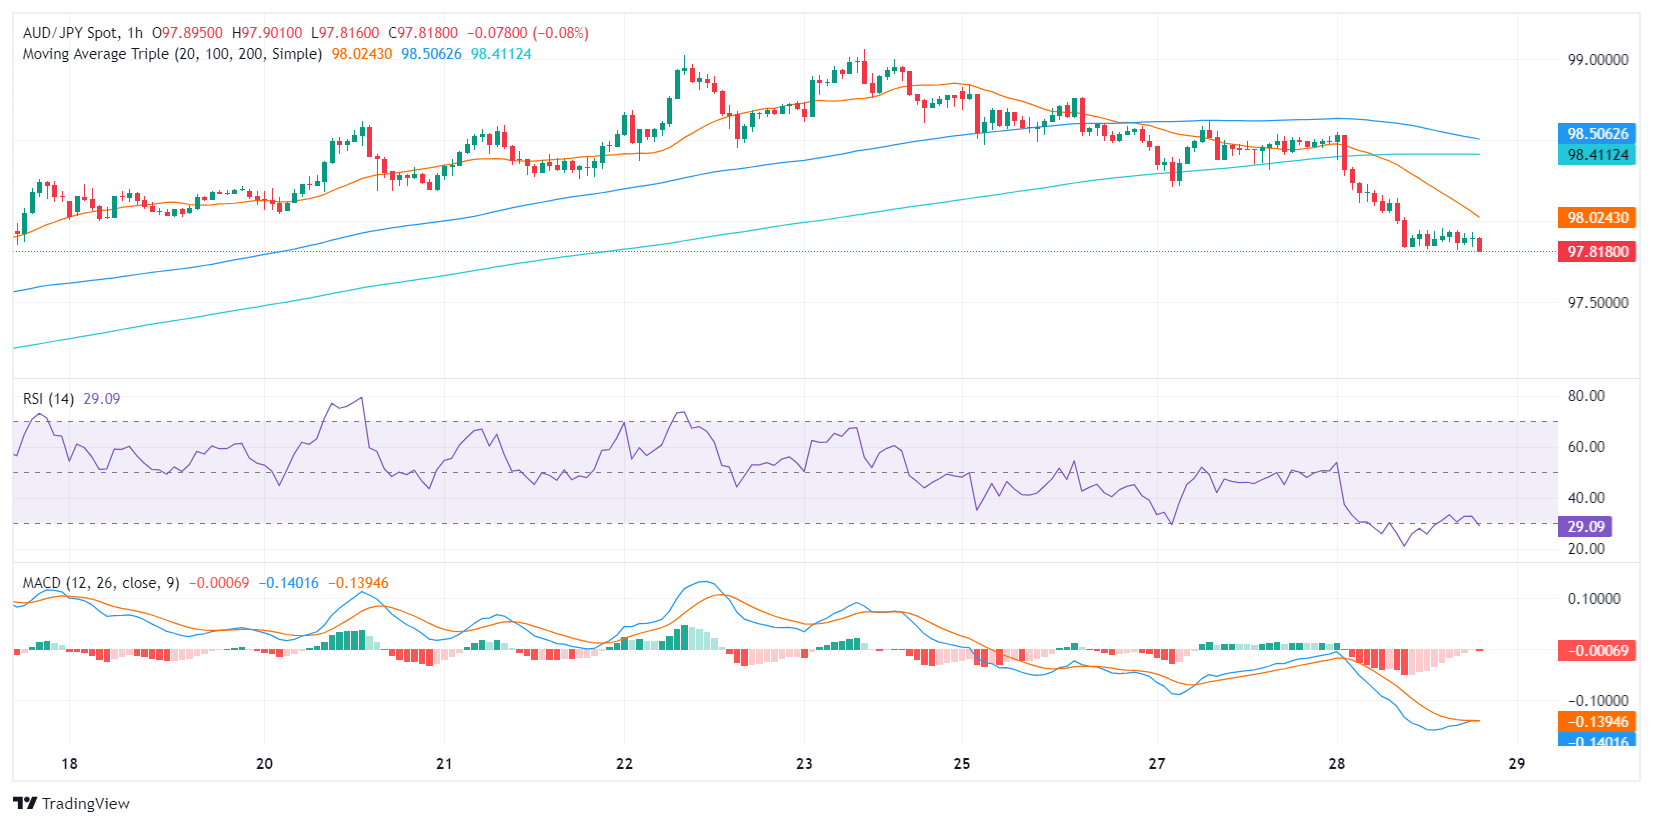
On the hourly chart, the RSI fluctuates in the negative territory, signaling increased selling activity. However, presenting a sharp contrast to the daily chart data, the hourly RSI ventures into the oversold area, which often points to a potential price correction in the near term to the upside. Also, the hourly MACD illustrates a weakening bearish momentum as suggested by the decreasing red bars which may suggest that an upward correction may be incoming..
AUD/JPY hourly chart
In retrospect, while the daily data illustrates a bullish trend, the hourly data presents that the bears took control but a slight upward correction shouldn’t be taken off the table for the rest of the session. The pair remains above the key Simple Moving Averages of 20,100 and 200 days, indicating a long-term bullish sentiment, despite short-term bearish glimpses.


© 2000-2026. All rights reserved.
This site is managed by Teletrade D.J. LLC 2351 LLC 2022 (Euro House, Richmond Hill Road, Kingstown, VC0100, St. Vincent and the Grenadines).
The information on this website is for informational purposes only and does not constitute any investment advice.
The company does not serve or provide services to customers who are residents of the US, Canada, Iran, The Democratic People's Republic of Korea, Yemen and FATF blacklisted countries.
Making transactions on financial markets with marginal financial instruments opens up wide possibilities and allows investors who are willing to take risks to earn high profits, carrying a potentially high risk of losses at the same time. Therefore you should responsibly approach the issue of choosing the appropriate investment strategy, taking the available resources into account, before starting trading.
Use of the information: full or partial use of materials from this website must always be referenced to TeleTrade as the source of information. Use of the materials on the Internet must be accompanied by a hyperlink to teletrade.org. Automatic import of materials and information from this website is prohibited.
Please contact our PR department if you have any questions or need assistance at pr@teletrade.global.
transfers