- Analytics
- News and Tools
- Market News
- NZD/JPY bears step in after RBNZ dovish hold
NZD/JPY bears step in after RBNZ dovish hold
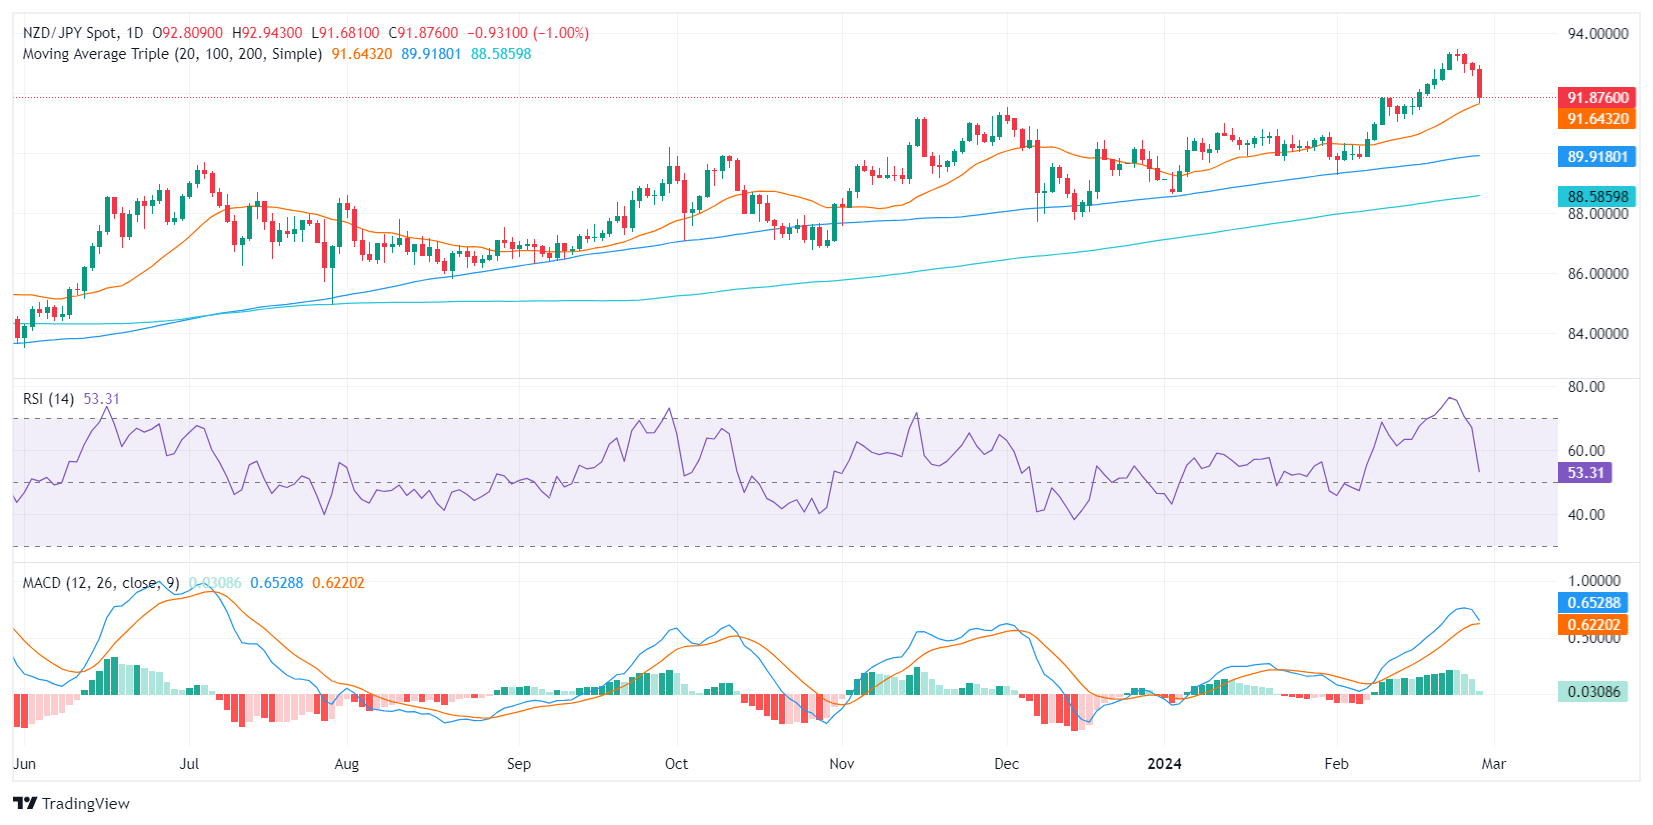
- The NZD/JPY is currently trading at 91.84, registering a significant drop of 1% in Wednesday's session.
- The RBNZ's dovish hold during the Asian session significantly weakened the NZD.
- The daily RSI indicates a possible shift in momentum, with NZD/JPY buyer strength declining from the overbought territory near 50..
- A short-term advantage for sellers is evident, with hourly RSI values oscillating near oversold territory.
In Wednesday's session, the NZD/JPY dived towards the 91.84 level, recording a notable decline of 1%. The main driver of this movement was the dovish decision from the Reserve Bank of New Zealand (RBNZ) which contributed to the Kiwi being the weakest currency in the session.
The RBNZ held the rates steady at 5.5%, with a revised outlook reducing the likelihood of another 25 bps hike from 75% to 40%. In addition, the bank cut down near-term Gross Domestic Product (GDP) growth projections, slightly adjusting inflation projections downwards. It expects, however, that inflation will return to the 1-3% target band in Q3 2025, implying the persistence of a tighter monetary policy. As a reaction, the combination of projections of a weaker economic activity with expectations of fewer hikes drove the Kiwi’s selloff.
NZD/JPY technical analysis
The daily Relative Strength Index (RSI) recently slid from the overbought territory and took a big hit in Wednesday’s session. This signals a potential turnaround moment, although the pair maintains a positive outlook within the broader technical landscape, as affirmed by its position above the 20,100,200-day Simple Moving Averages (SMAs). At the same time, the MACD histogram indicated a drop in bullish momentum, as marked by the shrinking green bars.
NZD/JPY daily chart
Interestingly, the hourly RSI values are oscillating within the negative territory, pointing to a short-term advantage for the sellers. Simultaneously, the MACD histogram on the hourly chart suggests the return of bullish momentum, as evidenced by the rising green bars. This hourly divergence hints at some level of intraday volatility for the NZD/JPY pair as indicators seem to be correcting oversold conditions.
NZD/JPY hourly chart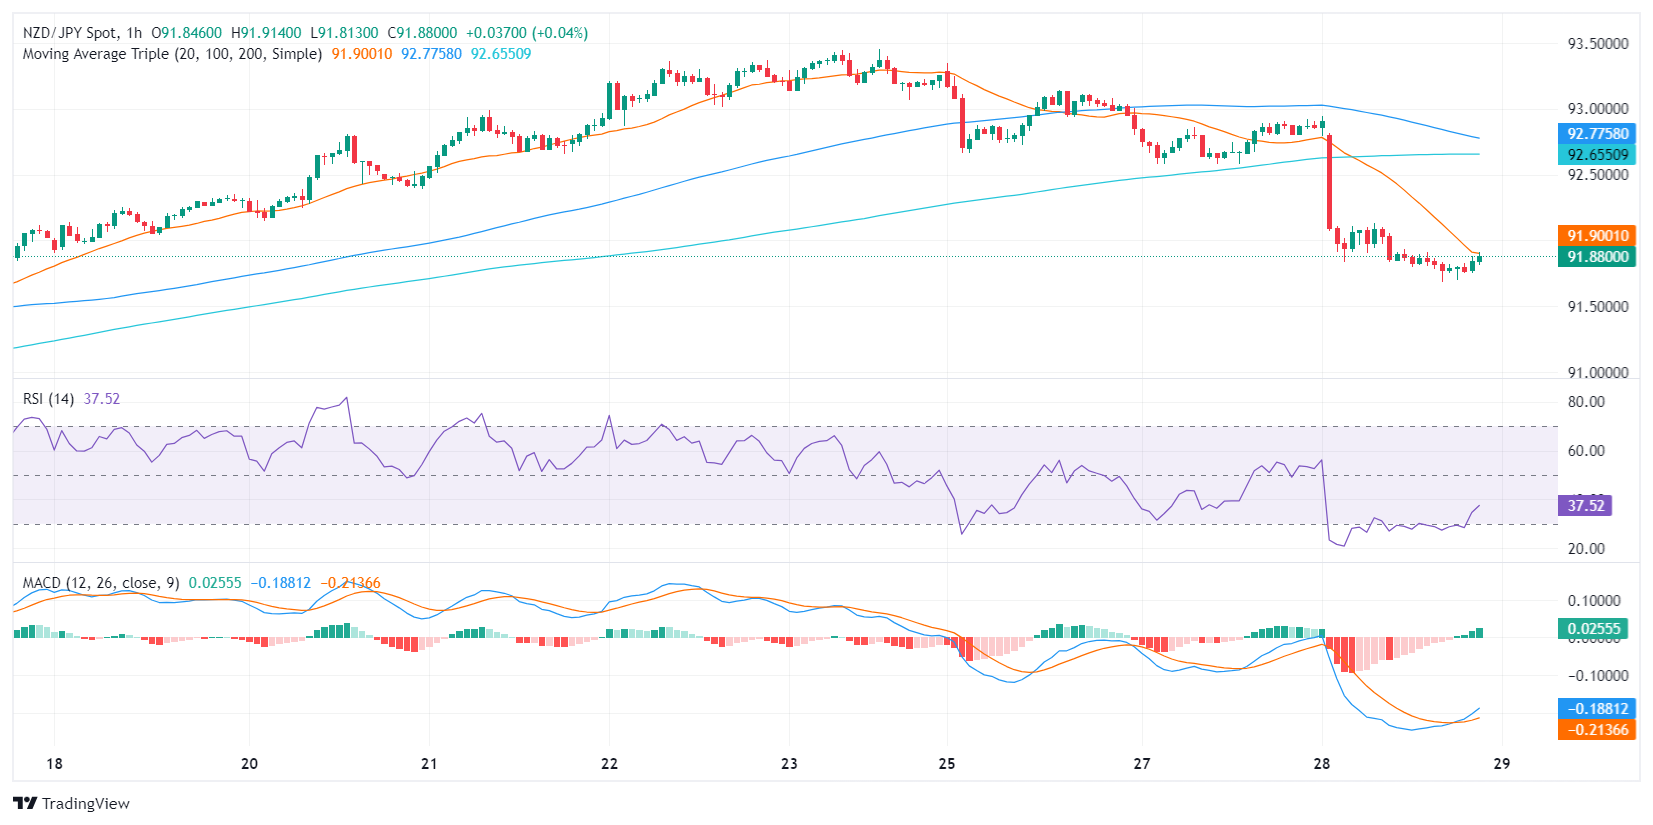


© 2000-2026. All rights reserved.
This site is managed by Teletrade D.J. LLC 2351 LLC 2022 (Euro House, Richmond Hill Road, Kingstown, VC0100, St. Vincent and the Grenadines).
The information on this website is for informational purposes only and does not constitute any investment advice.
The company does not serve or provide services to customers who are residents of the US, Canada, Iran, The Democratic People's Republic of Korea, Yemen and FATF blacklisted countries.
Making transactions on financial markets with marginal financial instruments opens up wide possibilities and allows investors who are willing to take risks to earn high profits, carrying a potentially high risk of losses at the same time. Therefore you should responsibly approach the issue of choosing the appropriate investment strategy, taking the available resources into account, before starting trading.
Use of the information: full or partial use of materials from this website must always be referenced to TeleTrade as the source of information. Use of the materials on the Internet must be accompanied by a hyperlink to teletrade.org. Automatic import of materials and information from this website is prohibited.
Please contact our PR department if you have any questions or need assistance at pr@teletrade.global.
transfers