- Analytics
- News and Tools
- Market News
- USD/CAD Price Analysis: Consolidates below 1.3600 ahead of US core PCE, Canadian Q4 GDP
USD/CAD Price Analysis: Consolidates below 1.3600 ahead of US core PCE, Canadian Q4 GDP
- USD/CAD trades sideways around 1.3570 ahead of the US and Canada economic data.
- The BoC may shift to rate cuts early if the Canadian Q4 GDP turns out weaker than expectations.
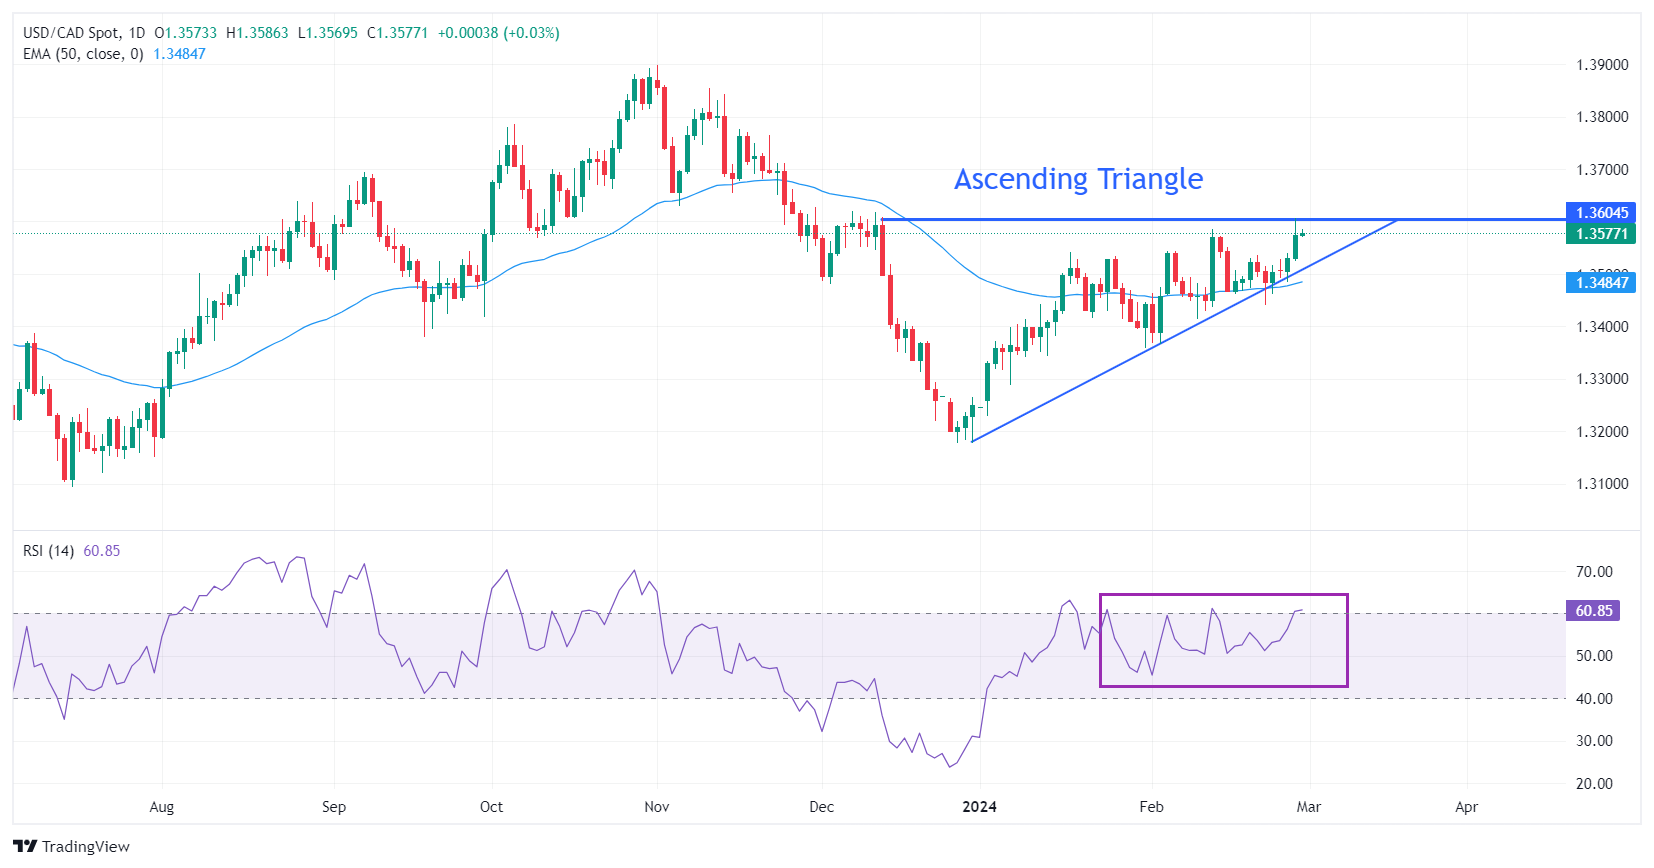
- The Loonie asset hovers around the horizontal resistance of the Ascending Triangle formation.
The USD/CAD pair is stuck in a tight range around 1.3570 in the European session on Thursday. The Loonie asset awaits the United States core Personal Consumption Expenditure Price Index (PCE) and the Canadian Q4 Gross Domestic Product (GDP) data for fresh guidance, both will be published at 13:30 GMT.
The US Dollar Index turns subdued ahead of the crucial US inflation data. The monthly core PCE Price Index data is anticipated to have grown by 0.4% in January against 0.2% increase in December. The annual underlying inflation data is forecasted to have grown at a slower pace of 2.8% vs. 2.9% growth in December.
On the Canadian Dollar front, the monthly GDP data for December is expected to have grown at a steady pace of 0.2%. The Bank of Canada (BoJ) projected earlier that the growth rate in the last quarter of 2023 will be flat. Weak GDP growth would deepen hopes of early rate cuts by the Bank of Canada (BoC).
USD/CAD aims to deliver a breakout of the Ascending Triangle chart pattern formed on a daily timeframe. The asset hovers around the horizontal resistance of the aforementioned pattern plotted from December 13 high at 1.3608, while the upward-sloping border is placed from December 29 low at 1.3178.
The near-term demand is upbeat as the pair is holding above the 50-day Exponential Moving Average (EMA), which trades around 1.3487.
The 14-period Relative Strength Index (RSI) climbs above 60.00, indicating that momentum leans toward the upside.
Fresh upside would appear if the asset breaks above December 13 high at 1.3608, which will drive the asset towards November 15 low at 1.3655, followed by the round-level resistance of 1.3700.
On the flip side, a downside move below February 22 low at 1.3441 would expose the asset to February 9 low at 1.3413. A breakdown below the latter would extend downside towards January 15 low at 1.3382.
USD/CAD daily chart


© 2000-2026. All rights reserved.
This site is managed by Teletrade D.J. LLC 2351 LLC 2022 (Euro House, Richmond Hill Road, Kingstown, VC0100, St. Vincent and the Grenadines).
The information on this website is for informational purposes only and does not constitute any investment advice.
The company does not serve or provide services to customers who are residents of the US, Canada, Iran, The Democratic People's Republic of Korea, Yemen and FATF blacklisted countries.
Making transactions on financial markets with marginal financial instruments opens up wide possibilities and allows investors who are willing to take risks to earn high profits, carrying a potentially high risk of losses at the same time. Therefore you should responsibly approach the issue of choosing the appropriate investment strategy, taking the available resources into account, before starting trading.
Use of the information: full or partial use of materials from this website must always be referenced to TeleTrade as the source of information. Use of the materials on the Internet must be accompanied by a hyperlink to teletrade.org. Automatic import of materials and information from this website is prohibited.
Please contact our PR department if you have any questions or need assistance at pr@teletrade.global.
transfers