- Analytics
- News and Tools
- Market News
- NZD/JPY Price Analysis: Bears take control conquering key level, hourly chart signals oversold conditions
NZD/JPY Price Analysis: Bears take control conquering key level, hourly chart signals oversold conditions
- The NZD/JPY is currently trading at around 91.20, recording a 0.73% decrease in Thursday's session.
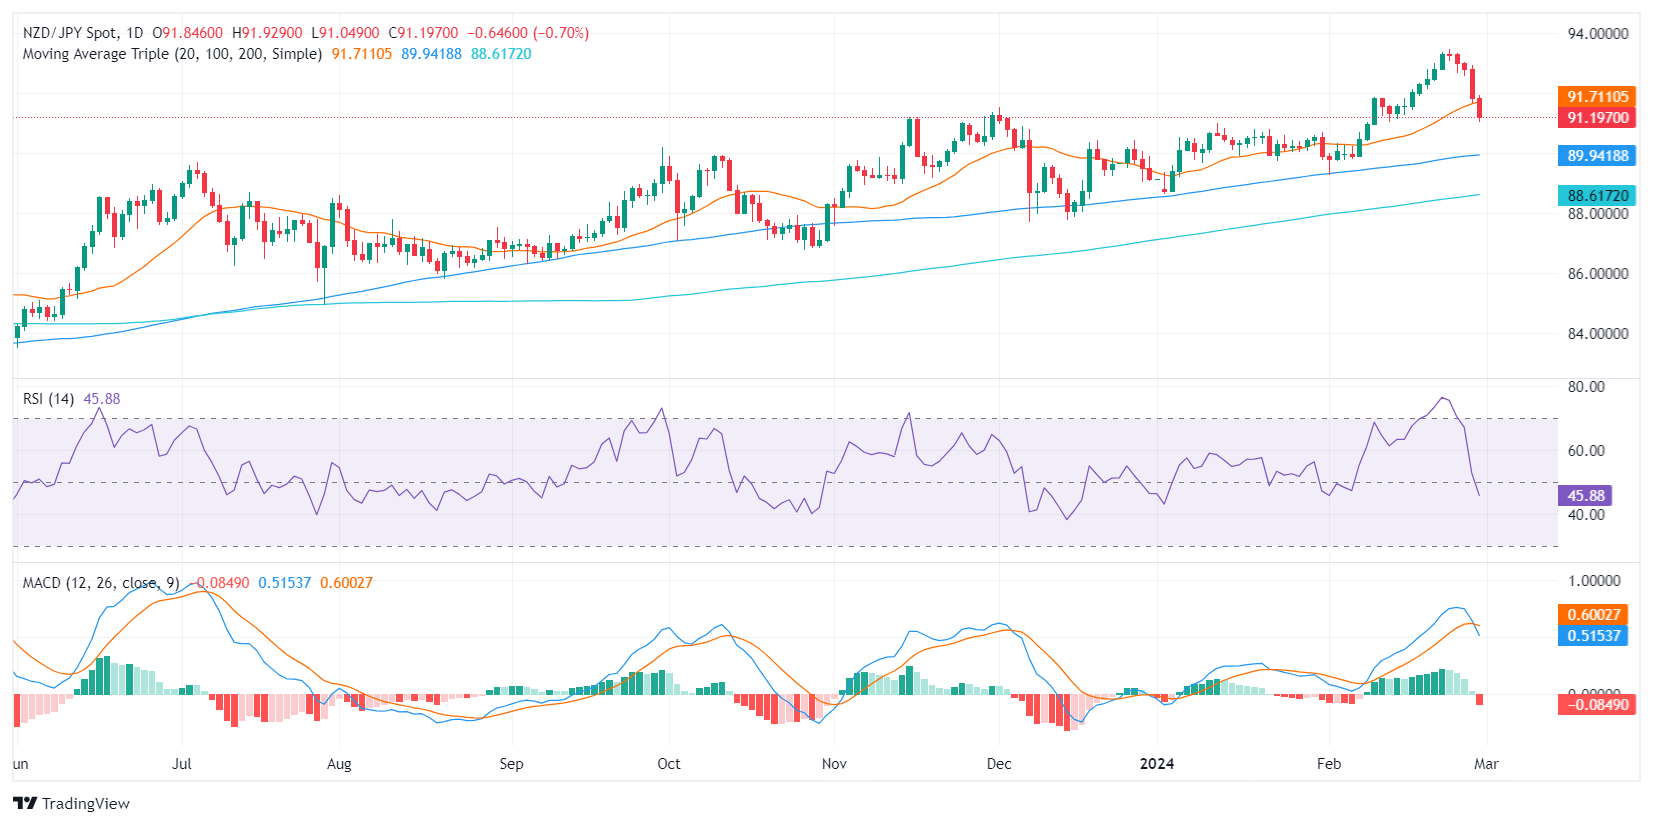
- Based on the daily chart, RSI suggests a shift from a bullish to a bearish area.
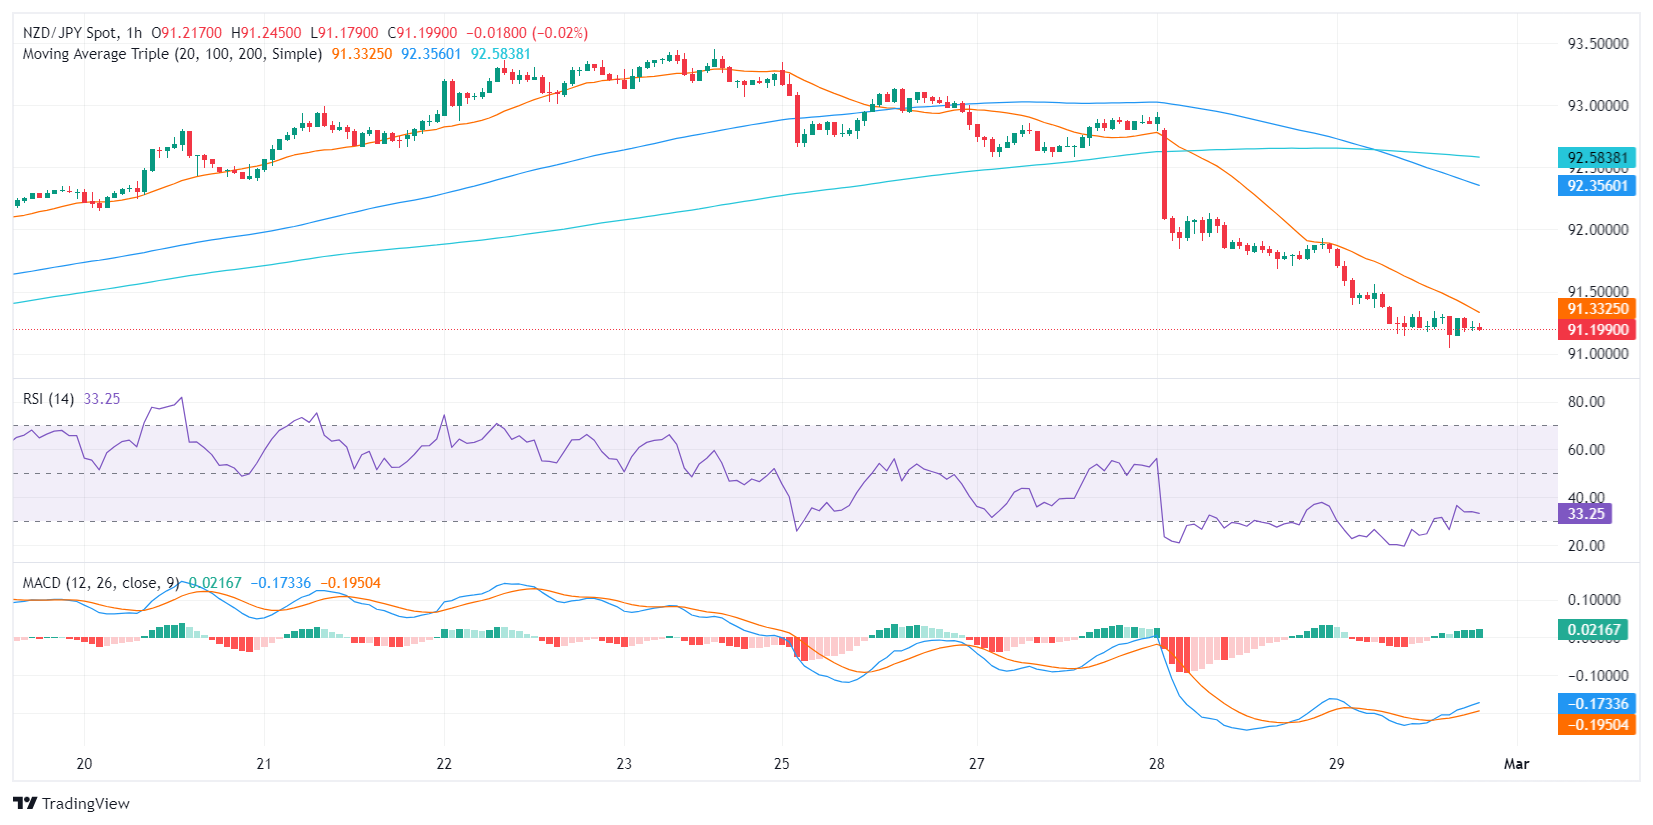
- A closer look at the hourly chart underlines the intensified selling pressure with the RSI residing near oversold territory.
- Despite these short-term bearish signals, the NZD/JPY is still operating above main SMAs suggesting a continued influence from long-term bullish buyers.
In Thursday's session, the NZD/JPY pair is trading substantially lower at around the 91.20 level, implying a potent selling momentum marking a 0.73% decrease on the day. Despite the immediate downward inclination, the pair maintains its stance in a broader bullish territory as long-term buyers retain control and these movements could be considered as a consolidation phase after reaching multi-year highs.
Based on the daily Relative Strength Index (RSI), the pair has recently fallen from positive territories into negative. Yet, before this transposition, the pair spent considerable time in overbought territories, which could indicate profit-taking movements. Turning now to the Moving Average Convergence Divergence (MACD) histogram, an uninterrupted sequence of increasing red bars is seen. These highlight an expansion in negative momentum, suggesting that sellers are currently dictating the market dynamics.
NZD/JPY daily chart
Shifting focus to the hourly chart, the RSI is noticeably near the oversold territories revealing how the selling pressure has accelerated. This is further strengthened when topped by the continuous red bars on the MACD in the hourly chart cementing the argument for the increased selling pace.
NZD/JPY hourly chart
Despite the bearish signals from the daily and hourly charts, the pair is still in broader bullish territory as it lies above the 100 and 200-day Simple Moving Averages (SMAs), showing that long-term buyers are still in command. This discrepancy could imply a temporary bearish correction within an overall bullish trend ordained by the alignment of the SMAs.


© 2000-2026. All rights reserved.
This site is managed by Teletrade D.J. LLC 2351 LLC 2022 (Euro House, Richmond Hill Road, Kingstown, VC0100, St. Vincent and the Grenadines).
The information on this website is for informational purposes only and does not constitute any investment advice.
The company does not serve or provide services to customers who are residents of the US, Canada, Iran, The Democratic People's Republic of Korea, Yemen and FATF blacklisted countries.
Making transactions on financial markets with marginal financial instruments opens up wide possibilities and allows investors who are willing to take risks to earn high profits, carrying a potentially high risk of losses at the same time. Therefore you should responsibly approach the issue of choosing the appropriate investment strategy, taking the available resources into account, before starting trading.
Use of the information: full or partial use of materials from this website must always be referenced to TeleTrade as the source of information. Use of the materials on the Internet must be accompanied by a hyperlink to teletrade.org. Automatic import of materials and information from this website is prohibited.
Please contact our PR department if you have any questions or need assistance at pr@teletrade.global.
transfers