- Analytics
- News and Tools
- Market News
- AUD/USD dribbles back from Fed rally peak at 0.6580
AUD/USD dribbles back from Fed rally peak at 0.6580
- AUD/USD tested into nine-day high after Fed knocked the Greenback lower.
- Soft Aussie GDP limits gains as markets await another Fed outing.
- US NFP Friday still looms over the horizon.
AUD/USD knocked into a two-week high near 0.6580 after Federal Reserve (Fed) Chairman Jerome Powell kicked the legs out from underneath the US Dollar (USD) on Wednesday. Fed Chair Powell noted that the Fed doesn’t see increased risk of an economic recession in the US this year while testifying before the US Congressional House Financial Services Committee. The head of the US central bank is expected to deliver further comments on Thursday when he appears for day two of the Fed’s Semi-Annual Monetary Policy Report.
Jerome Powell Speech: Fed Chair says they are not climate change policymakers
Australia’s latest Gross Domestic Product (GDP) print early Wednesday capped gains for the Aussie (AUD), coming in below market expectations to print at 0.2% for the fourth quarter compared to the previous quarter’s 0.3%, which was revised slightly higher from 0.2%. Australia’s Trade Balance for February lands early Thursday at 00:30 GMT, and is expected to print at 11.5 billion after the previous month’s 10.959 billion.
China’s Trade Balance (in USD terms) is also expected early Thursday at 03:00 GMT, and is expected to drive market sentiment in the Asia market session. China’s USD-denominated Trade Balance for February is forecast to jump to $103.7 billion versus January’s $75.34 billion on mixed trade results. Chinese Imports are expected to climb 1.5% versus the previous 0.2%, while Exports growth is expected to slow to 1.9% from the previous 2.3%.
Friday’s US Nonfarm Payrolls (NFP) will wrap up the trading week, and markets are expecting the key jobs data to print at 200K for February compared to January’s 11-month high of 353K.
AUD/USD technical outlook
The AUD/USD climbed into a familiar technical resistance zone near 0.6580 before facing a rejection, dragging the pair back into 0.6560 and keeping the Aussie hung up in a thin chart region in the near-term.
Wednesday’s bullish candle represents one of the pair’s strongest performances since December, but the pair has run into a technical ceiling at the 200-day Simple Moving Average (SMA) near 0.6560, and bullish momentum is set to falter back into the 0.6500 handle is sellers return to the fold.
AUD/USD hourly chart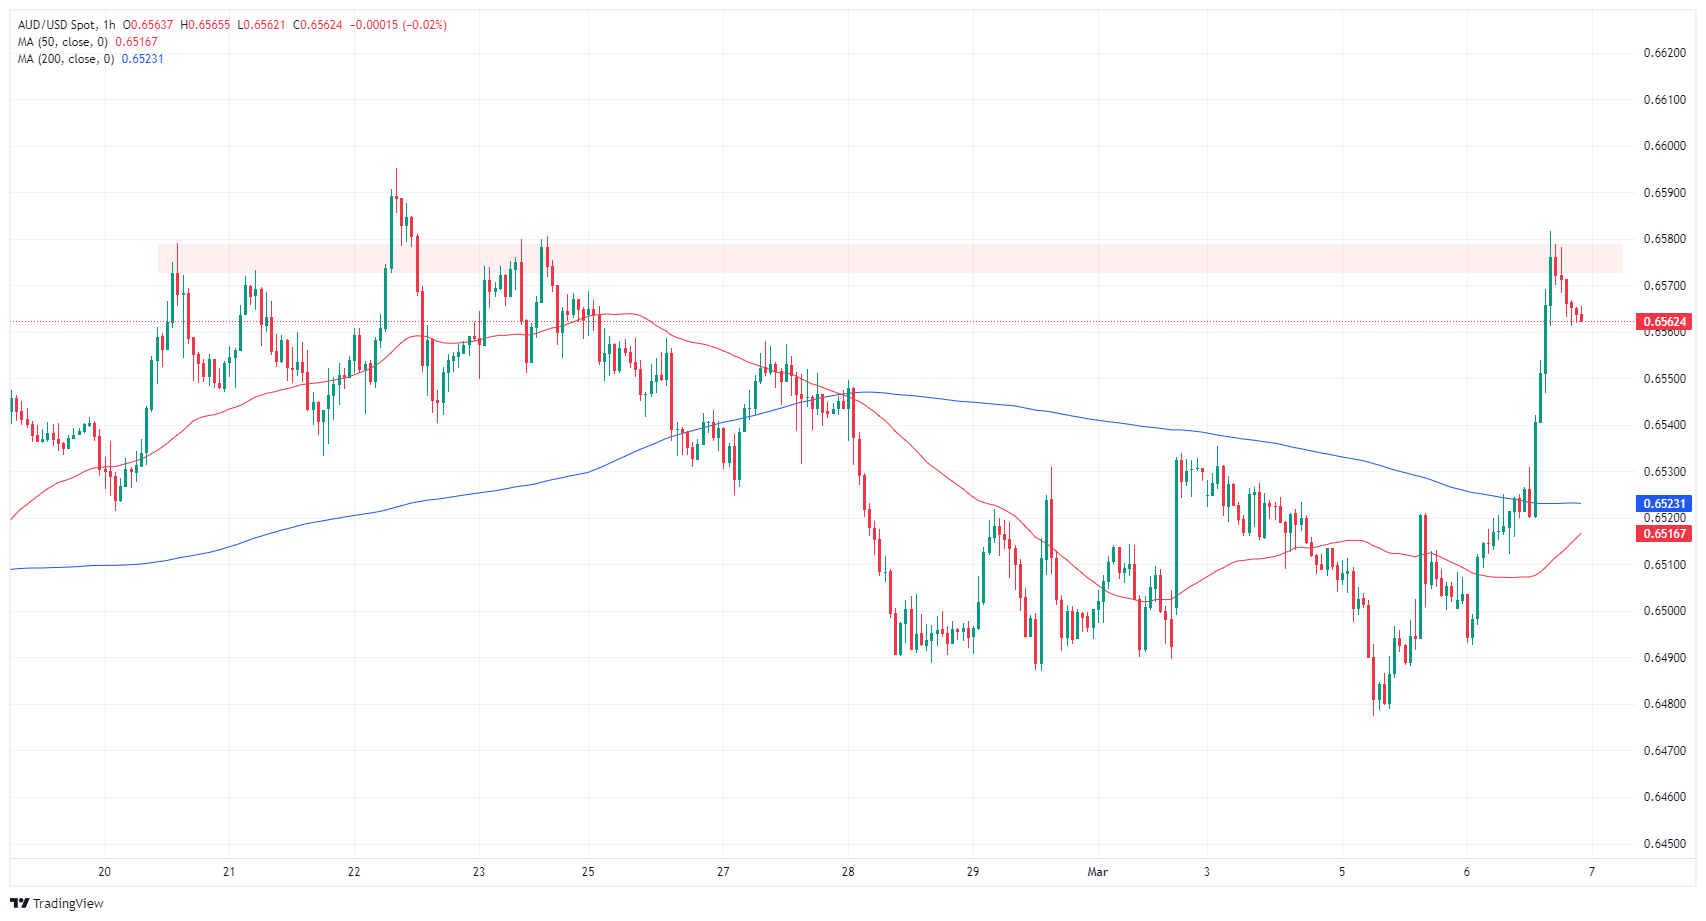
AUD/USD daily chart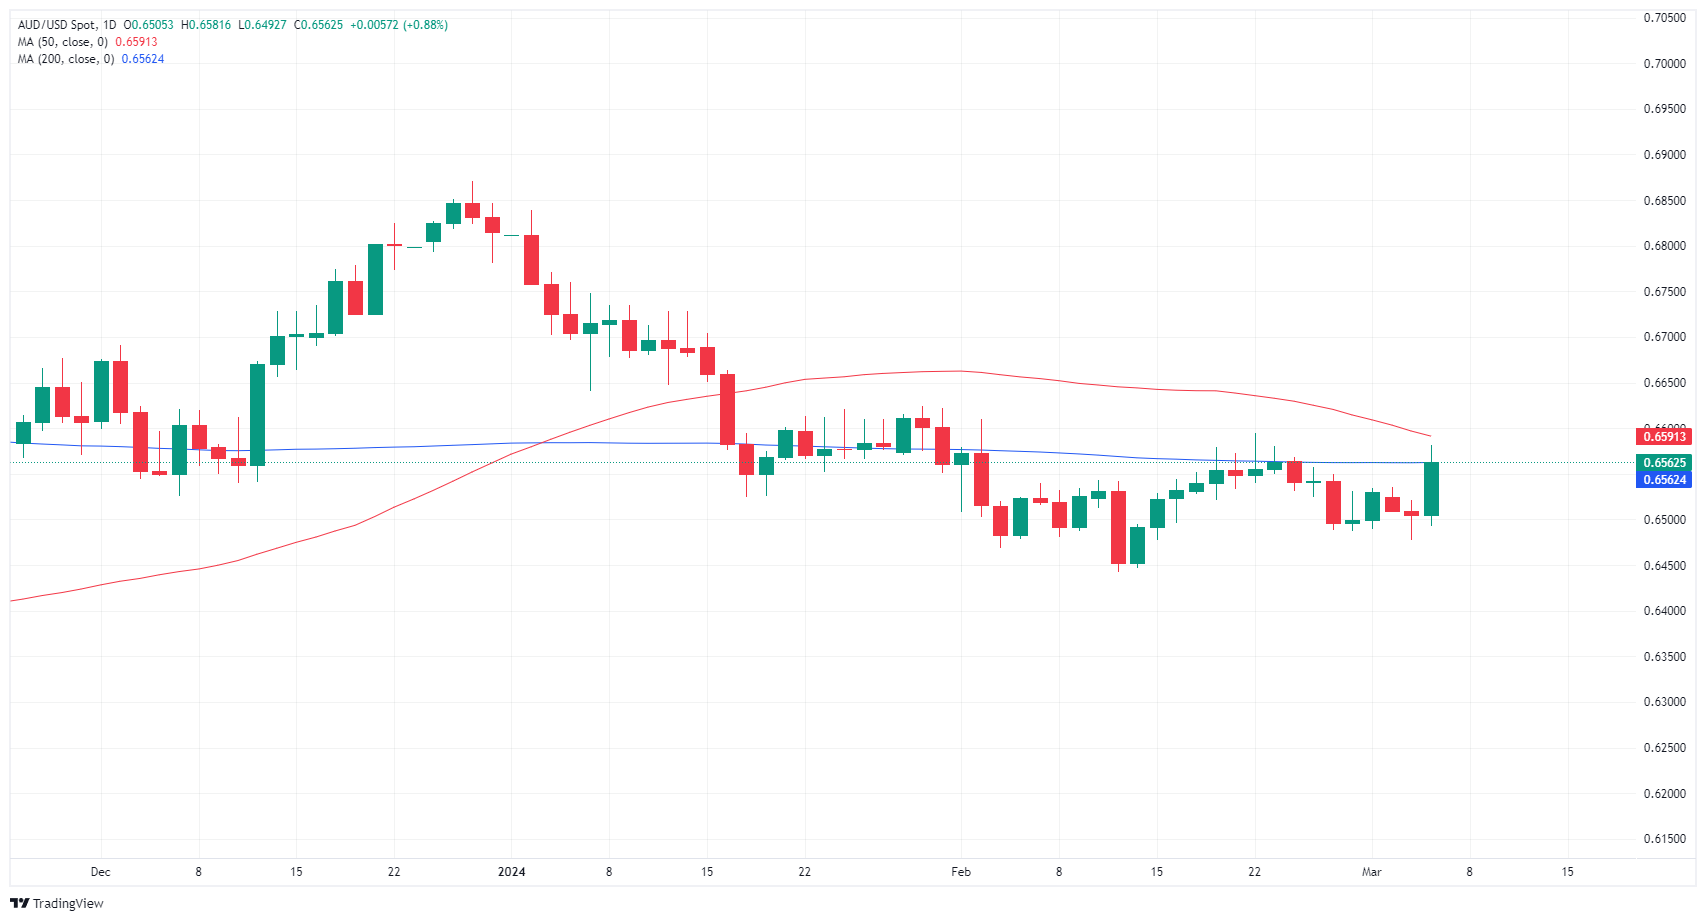


© 2000-2026. All rights reserved.
This site is managed by Teletrade D.J. LLC 2351 LLC 2022 (Euro House, Richmond Hill Road, Kingstown, VC0100, St. Vincent and the Grenadines).
The information on this website is for informational purposes only and does not constitute any investment advice.
The company does not serve or provide services to customers who are residents of the US, Canada, Iran, The Democratic People's Republic of Korea, Yemen and FATF blacklisted countries.
Making transactions on financial markets with marginal financial instruments opens up wide possibilities and allows investors who are willing to take risks to earn high profits, carrying a potentially high risk of losses at the same time. Therefore you should responsibly approach the issue of choosing the appropriate investment strategy, taking the available resources into account, before starting trading.
Use of the information: full or partial use of materials from this website must always be referenced to TeleTrade as the source of information. Use of the materials on the Internet must be accompanied by a hyperlink to teletrade.org. Automatic import of materials and information from this website is prohibited.
Please contact our PR department if you have any questions or need assistance at pr@teletrade.global.
transfers