- Analytics
- News and Tools
- Market News
- USD/JPY steady, but on the low end as investors knuckle down for US CPI inflation
USD/JPY steady, but on the low end as investors knuckle down for US CPI inflation
- USD/JPY remains just shy of 147.00 following last week’s declines.
- Japan’s Q4 GDP print early Monday missed the mark.
- US CPI inflation is expected to come in mixed.
USD/JPY kicked off the new week on the low side of the 147.00 handle, with the pair steeply off of March’s early highs above 150.00. Markets are geared up for Tuesday’s US CPI inflation print as investors continue to seek out signs the Federal Reserve (Fed) could be pushed into early rate cuts if inflation eases off rapidly enough.
Japan’s Q4 Gross Domestic Product (GDP) print came in below expectations, but managed to recover from the previous QoQ decline of -0.1%. Q4 GDP printed at 0.1%, missing the forecast 0.3%. Annualized Q4 GDP in Japan also missed the mark, coming in at 0.4% versus the forecast rebound of 1.1%, though GDP growth still improved from the previous figure of -0.4%.
US CPI Preview: Forecasts from 10 major banks, inflation still too high
February’s US MoM CPI print is expected to accelerate to 0.4% from 0.3% as uneven inflation continues to weigh. Core MoM CPI, which excludes food and energy prices, is expected to tick down to 0.3% from 0.4%.
Annualized CPI is forecast to hold at 3.1% with Core YoY CPI expected to come in at 0.3% versus the previous 0.4%.
USD/JPY technical outlook
USD/JPY is notably on the week side heading into a new trading week, with the pair pinned on the south side of the 147.00 handle heading into the early Tuesday session. The pair is down over 2.5% from March’s peak bids near 150.70, with February’s all-time highs at 150.88.
Last week accelerated into the bearish side, extending a technical drag down the chart paper after the previous week snapped an eight-week winning streak. USD/JPY has closed flat or in the green for eight consecutive weeks, but now the pair is getting dragged back into bear country. The last meaningful technical floor sits at the last swing low into the 146.00 handle, with the 200-day Simple Moving Average (SMA) rising into 146.22.
USD/JPY hourly chart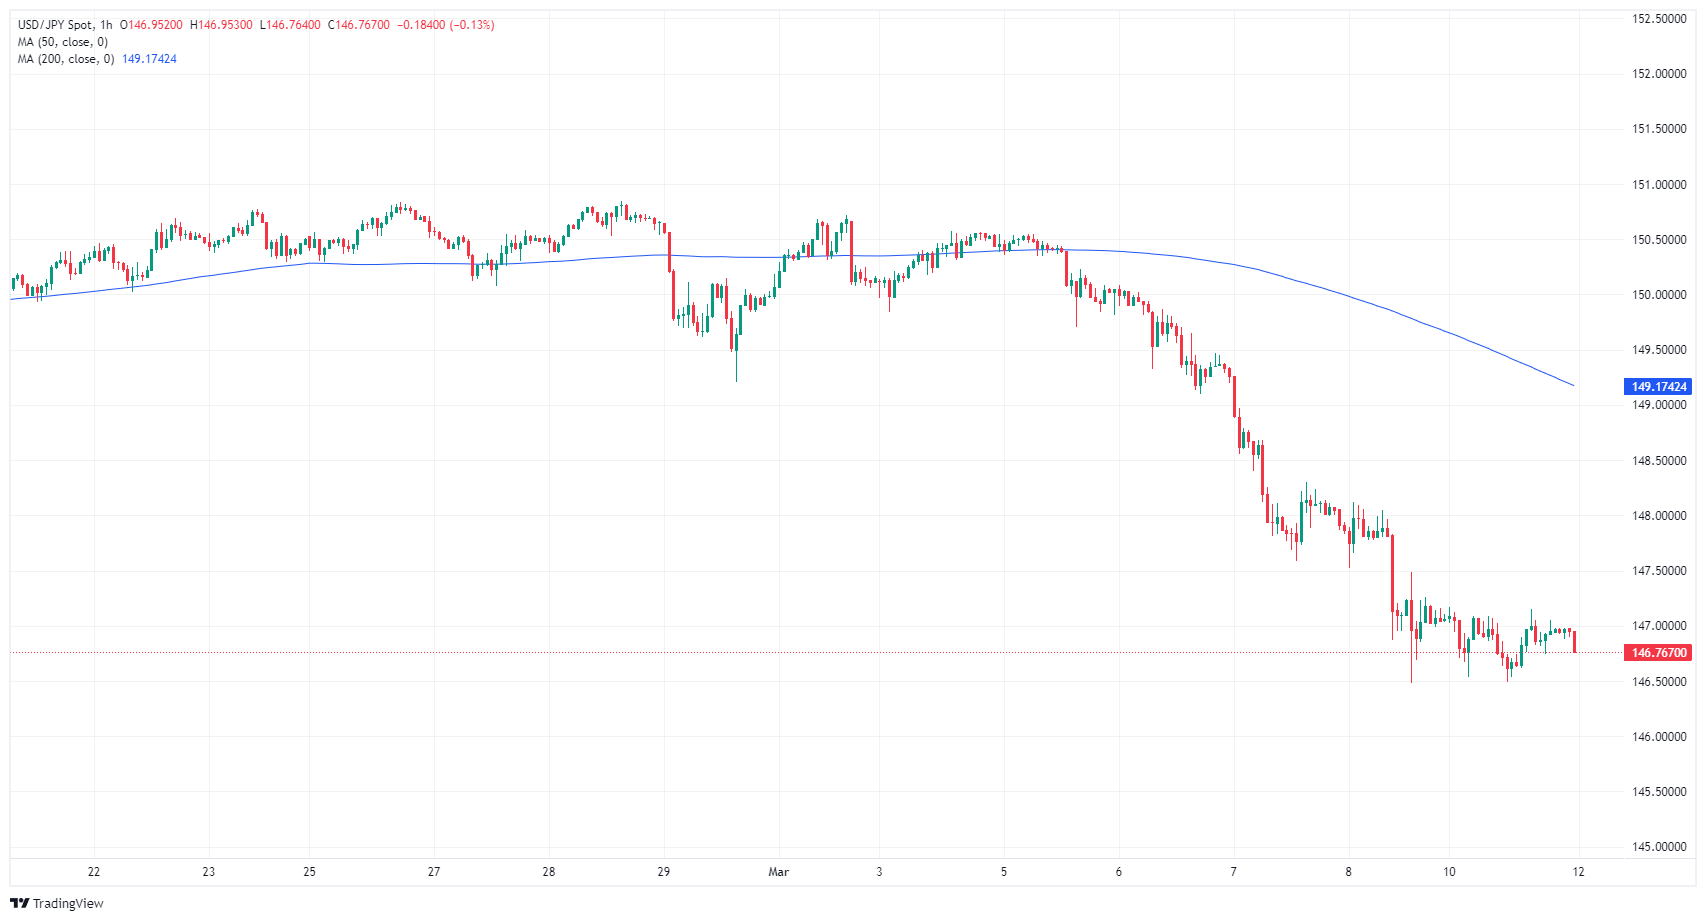


© 2000-2026. All rights reserved.
This site is managed by Teletrade D.J. LLC 2351 LLC 2022 (Euro House, Richmond Hill Road, Kingstown, VC0100, St. Vincent and the Grenadines).
The information on this website is for informational purposes only and does not constitute any investment advice.
The company does not serve or provide services to customers who are residents of the US, Canada, Iran, The Democratic People's Republic of Korea, Yemen and FATF blacklisted countries.
Making transactions on financial markets with marginal financial instruments opens up wide possibilities and allows investors who are willing to take risks to earn high profits, carrying a potentially high risk of losses at the same time. Therefore you should responsibly approach the issue of choosing the appropriate investment strategy, taking the available resources into account, before starting trading.
Use of the information: full or partial use of materials from this website must always be referenced to TeleTrade as the source of information. Use of the materials on the Internet must be accompanied by a hyperlink to teletrade.org. Automatic import of materials and information from this website is prohibited.
Please contact our PR department if you have any questions or need assistance at pr@teletrade.global.
transfers