- Analytics
- News and Tools
- Market News
- GBP/USD Price Analysis: Rally stalls after touching 200-week SMA
GBP/USD Price Analysis: Rally stalls after touching 200-week SMA
- GBP/USD has pulled back after touching resistance from the 200-week SMA.
- The pair could be forming an ABC move on the daily chart with a target in the 1.3000s.
- The 4-hour chart is looking a little vulnerable but remains supported for now.
GBP/USD has been rallying higher but it has stalled at the start of the new week after touching resistance at the 200-week Simple Moving Average (SMA). So far, the pullback looks like a correction in an evolving uptrend.
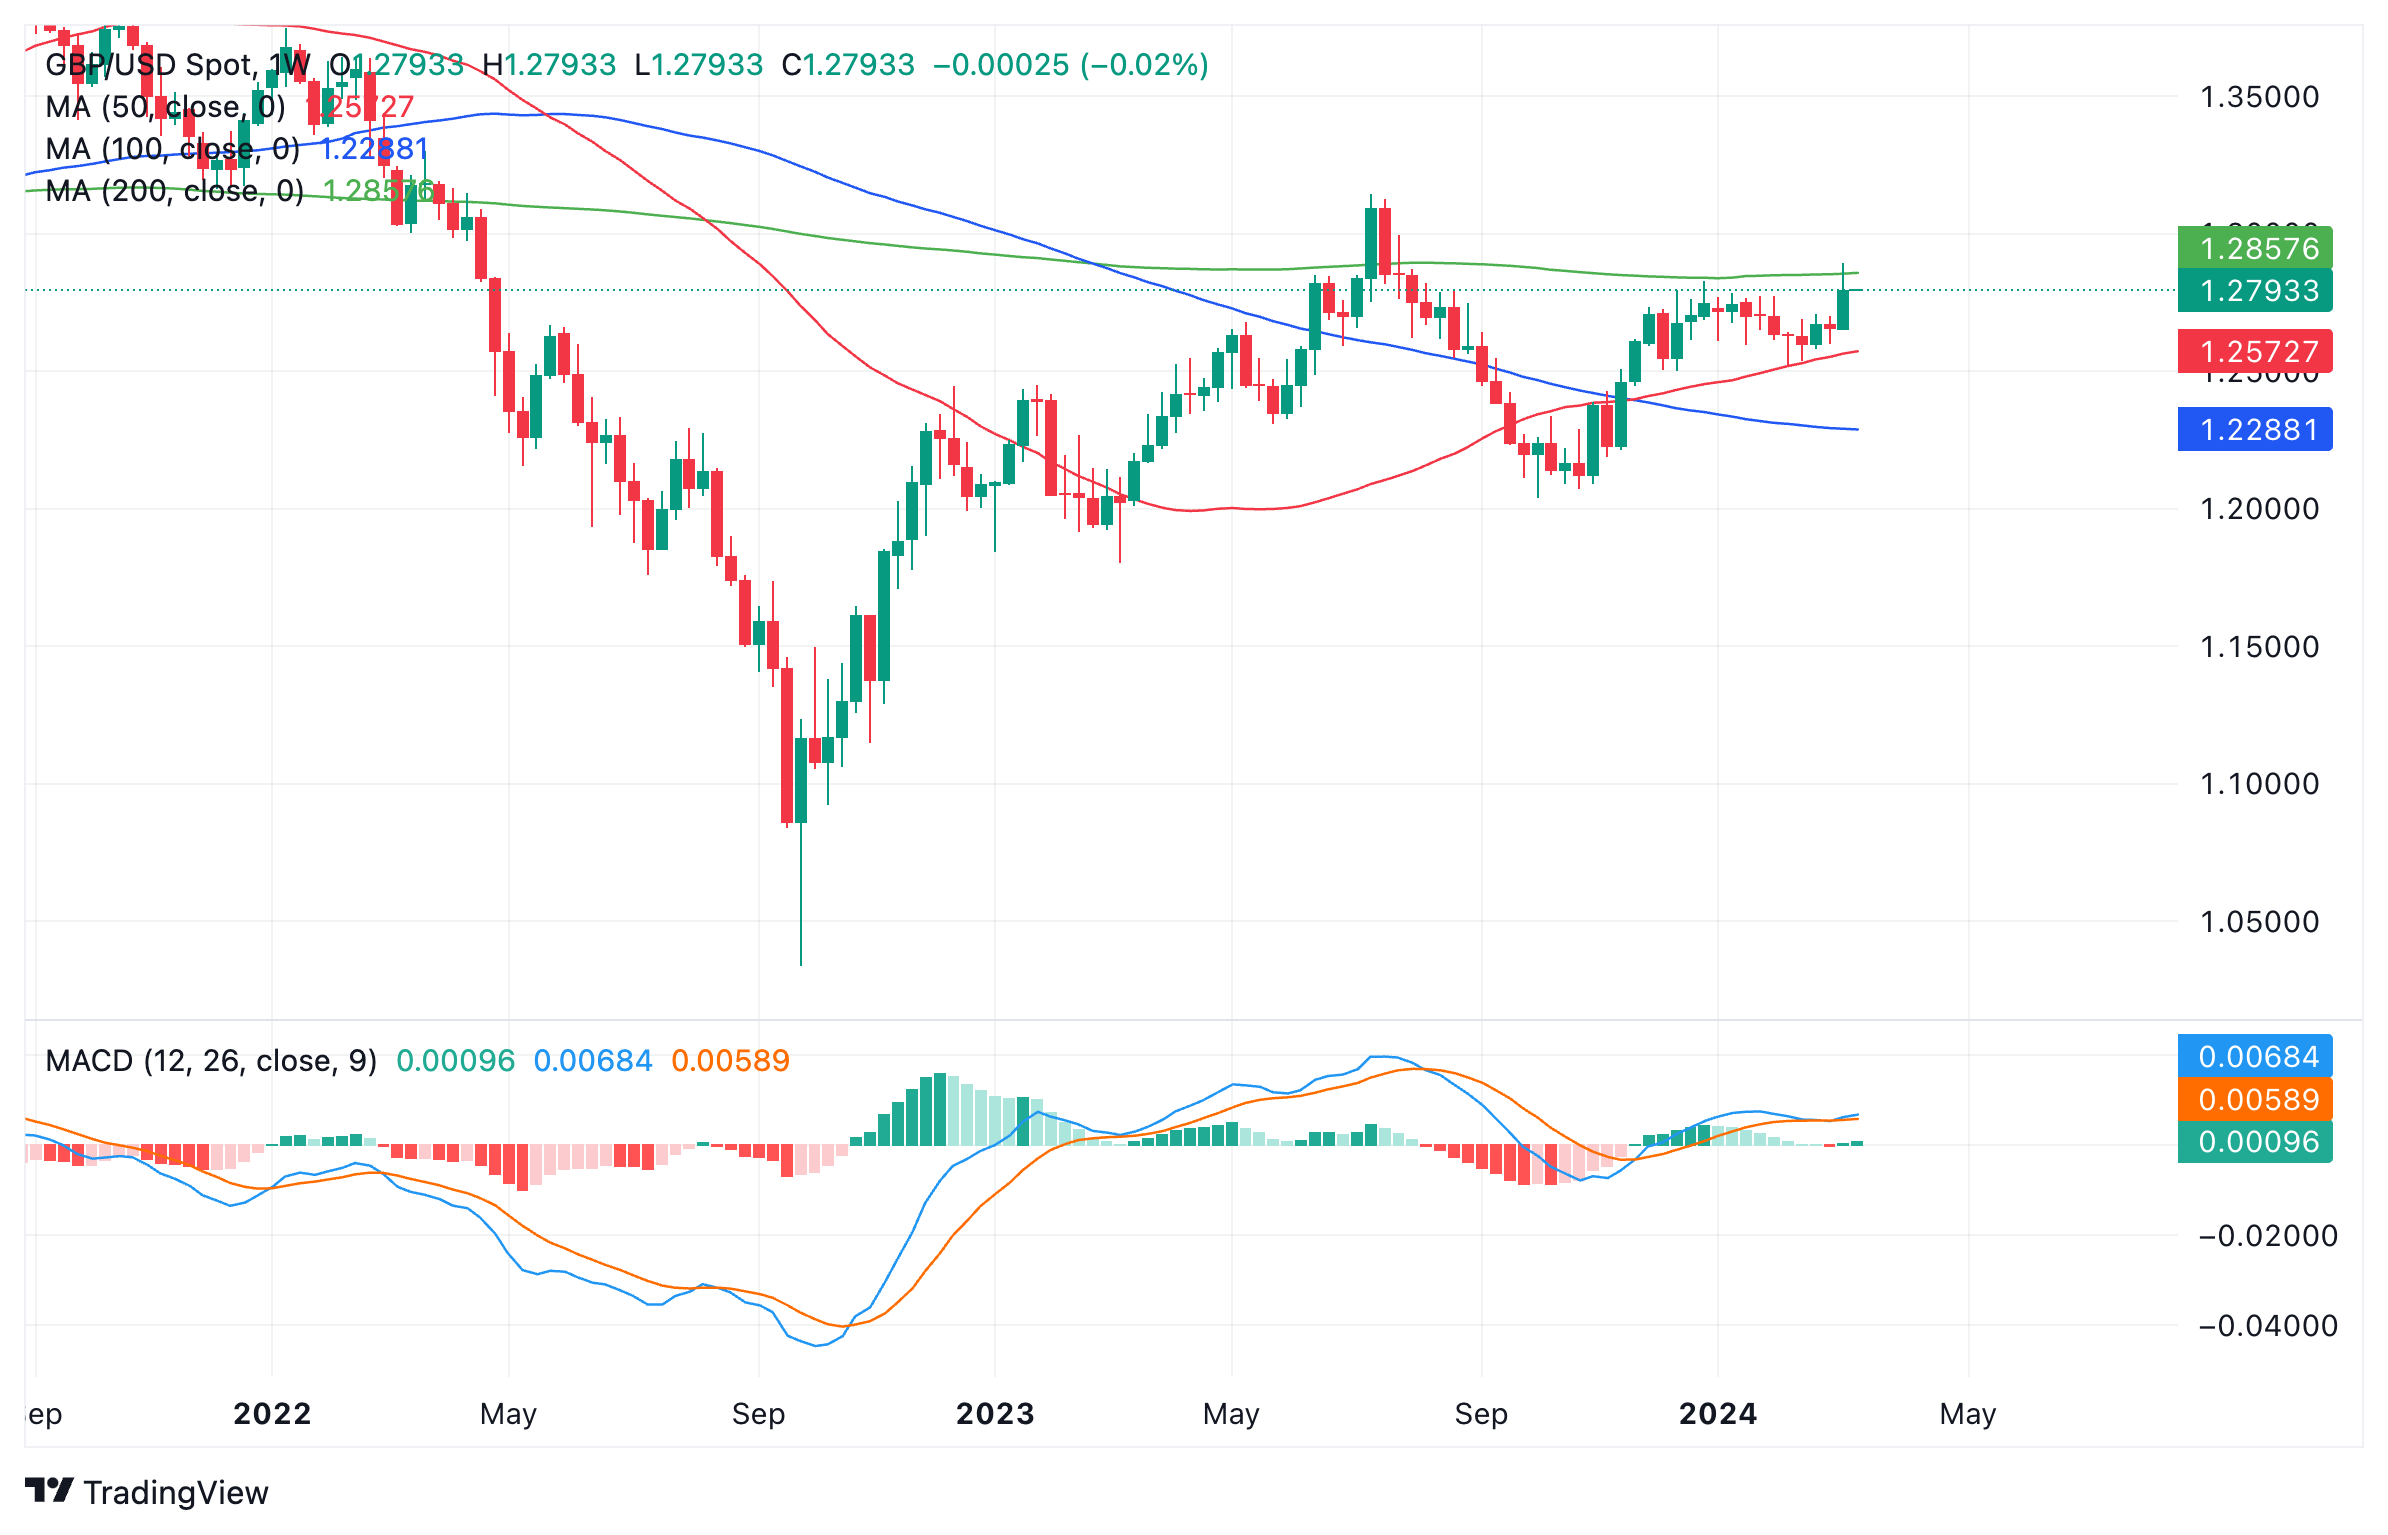
Pound Sterling vs US Dollar: Weekly chart
The pair has probably formed a bullish three-wave ABC Measured Move. If so, we are currently in the middle of the C wave, which should end somewhere between 1.3045 – 61.8% Fibonacci extension of wave A – and 1.3340, which is where C is 100% of A. The July highs in the 1.3130s is another target for the end of C.
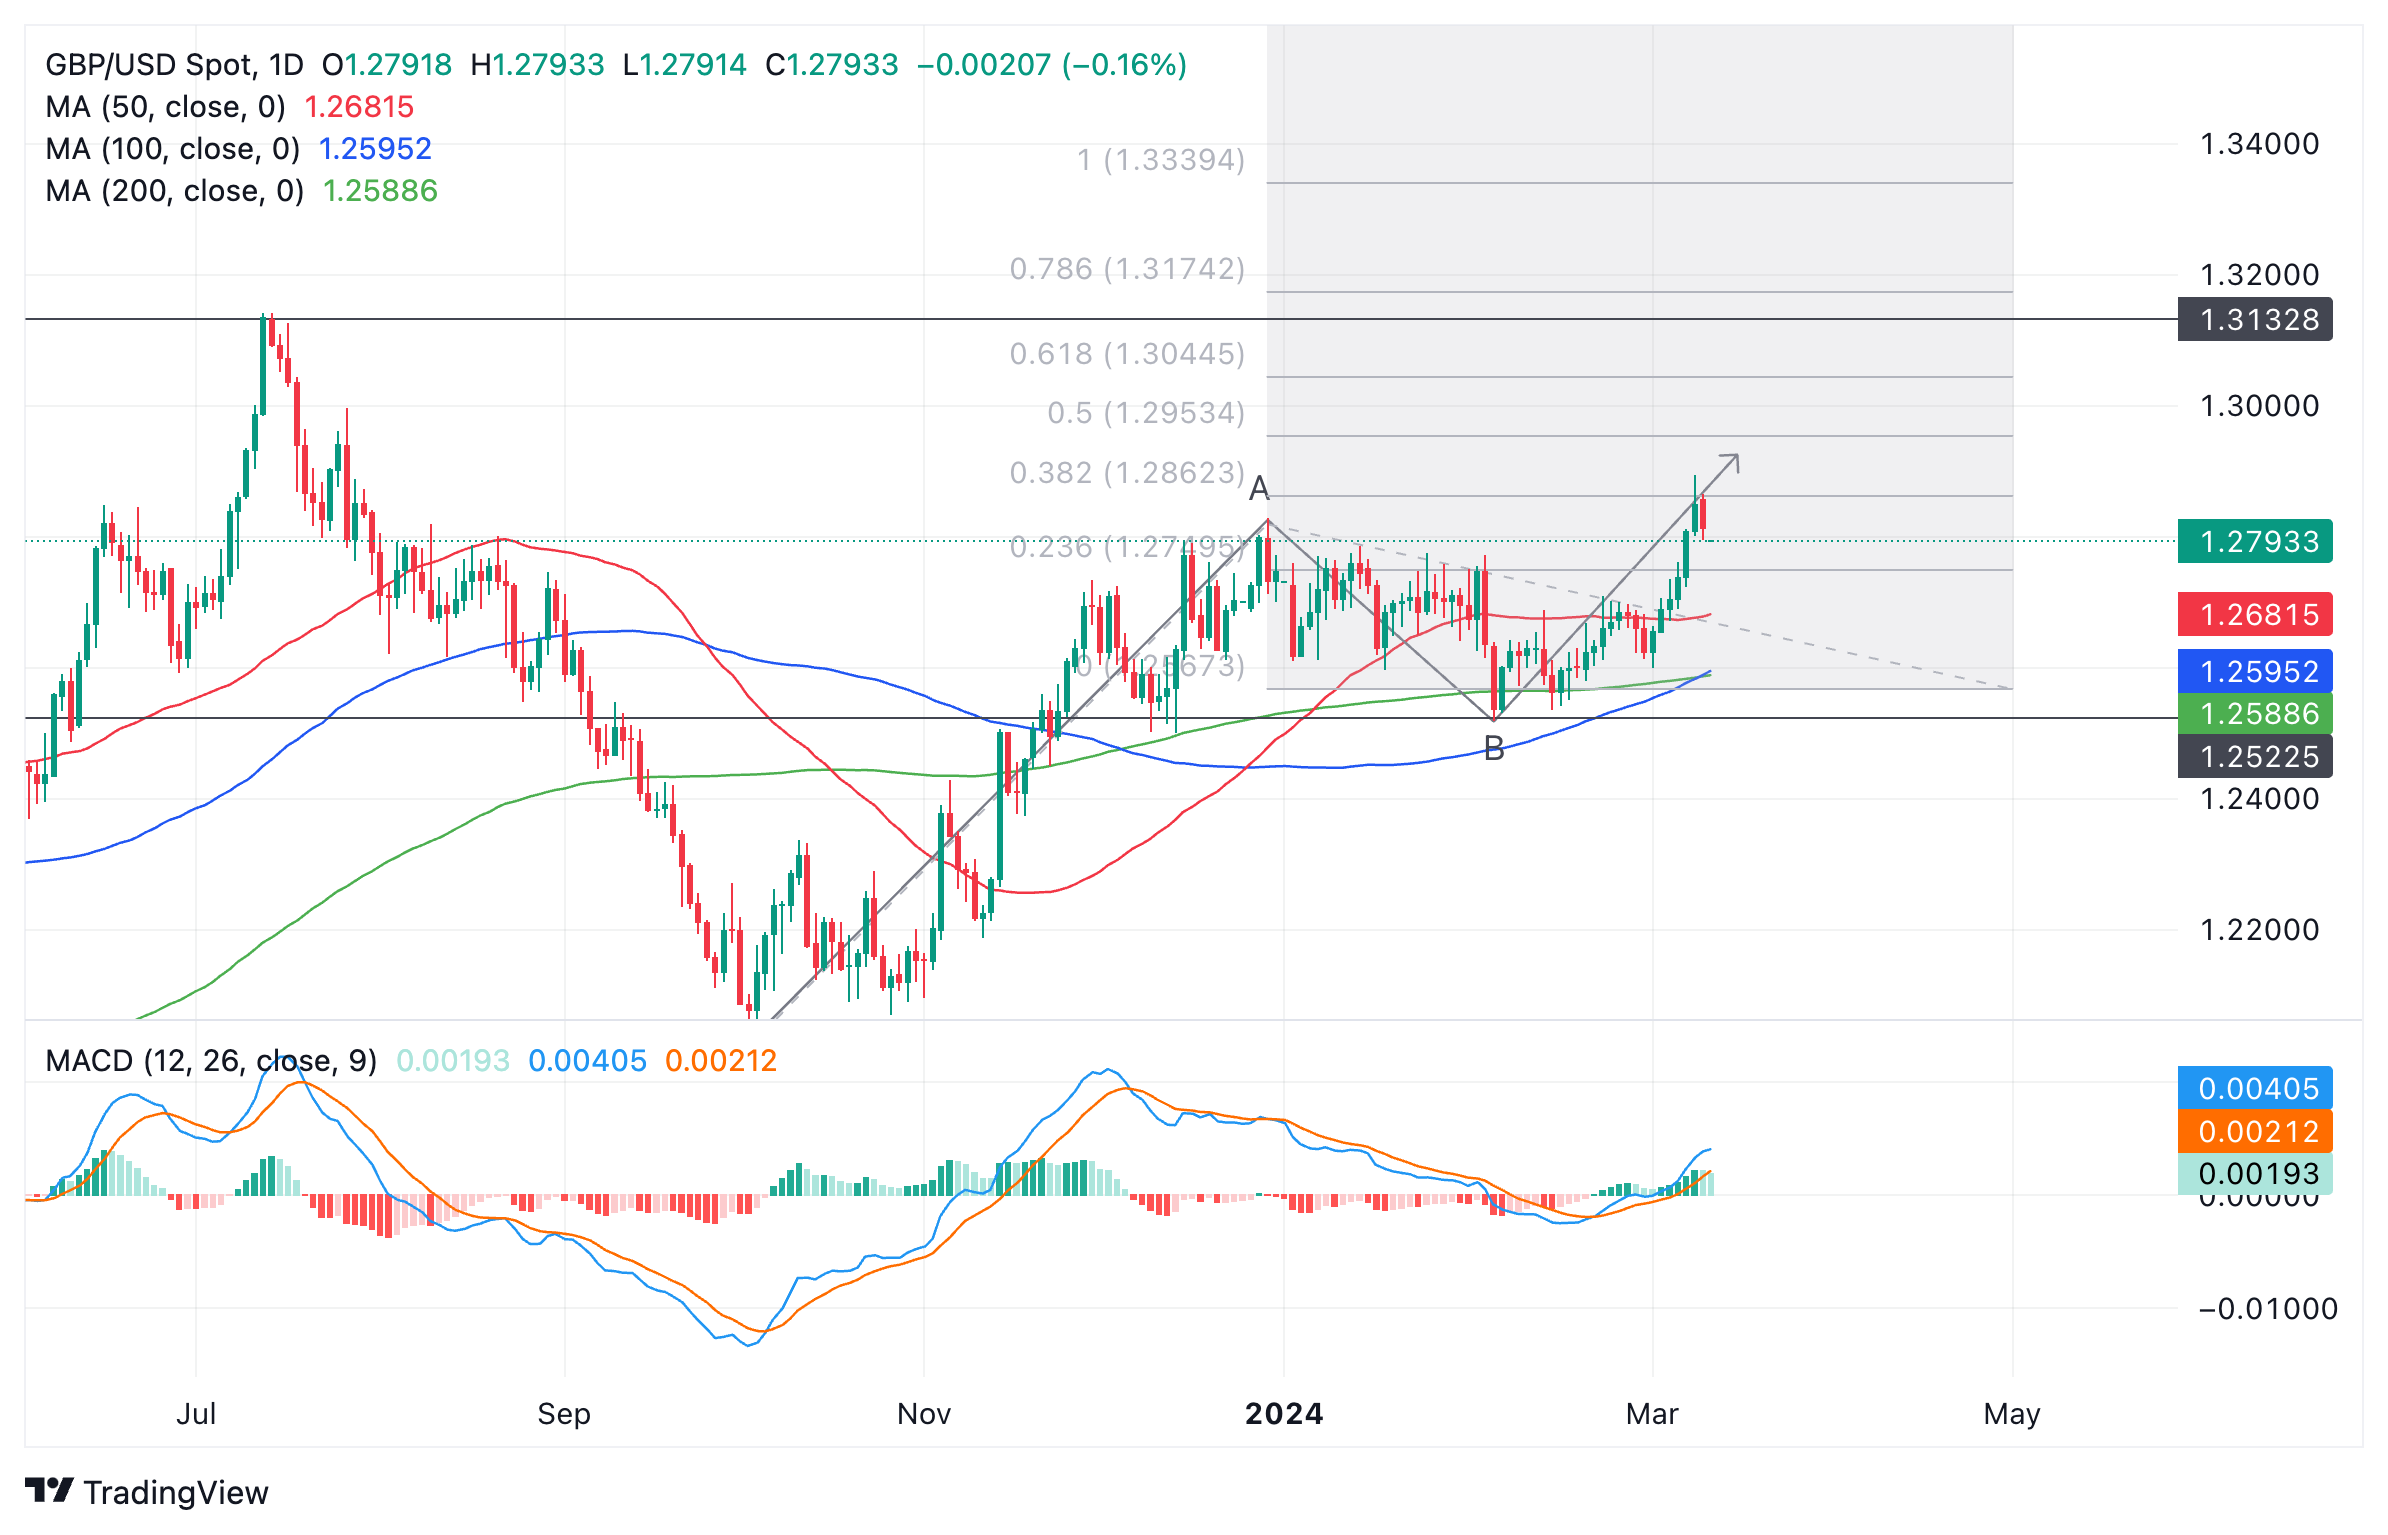
Pound Sterling vs US Dollar: Daily chart
A strong, decisive move back above the 1.2890 highs could provide the confirmation of an extension of C to its target.
The 4-hour chart below shows a less bullish short-term technical picture.
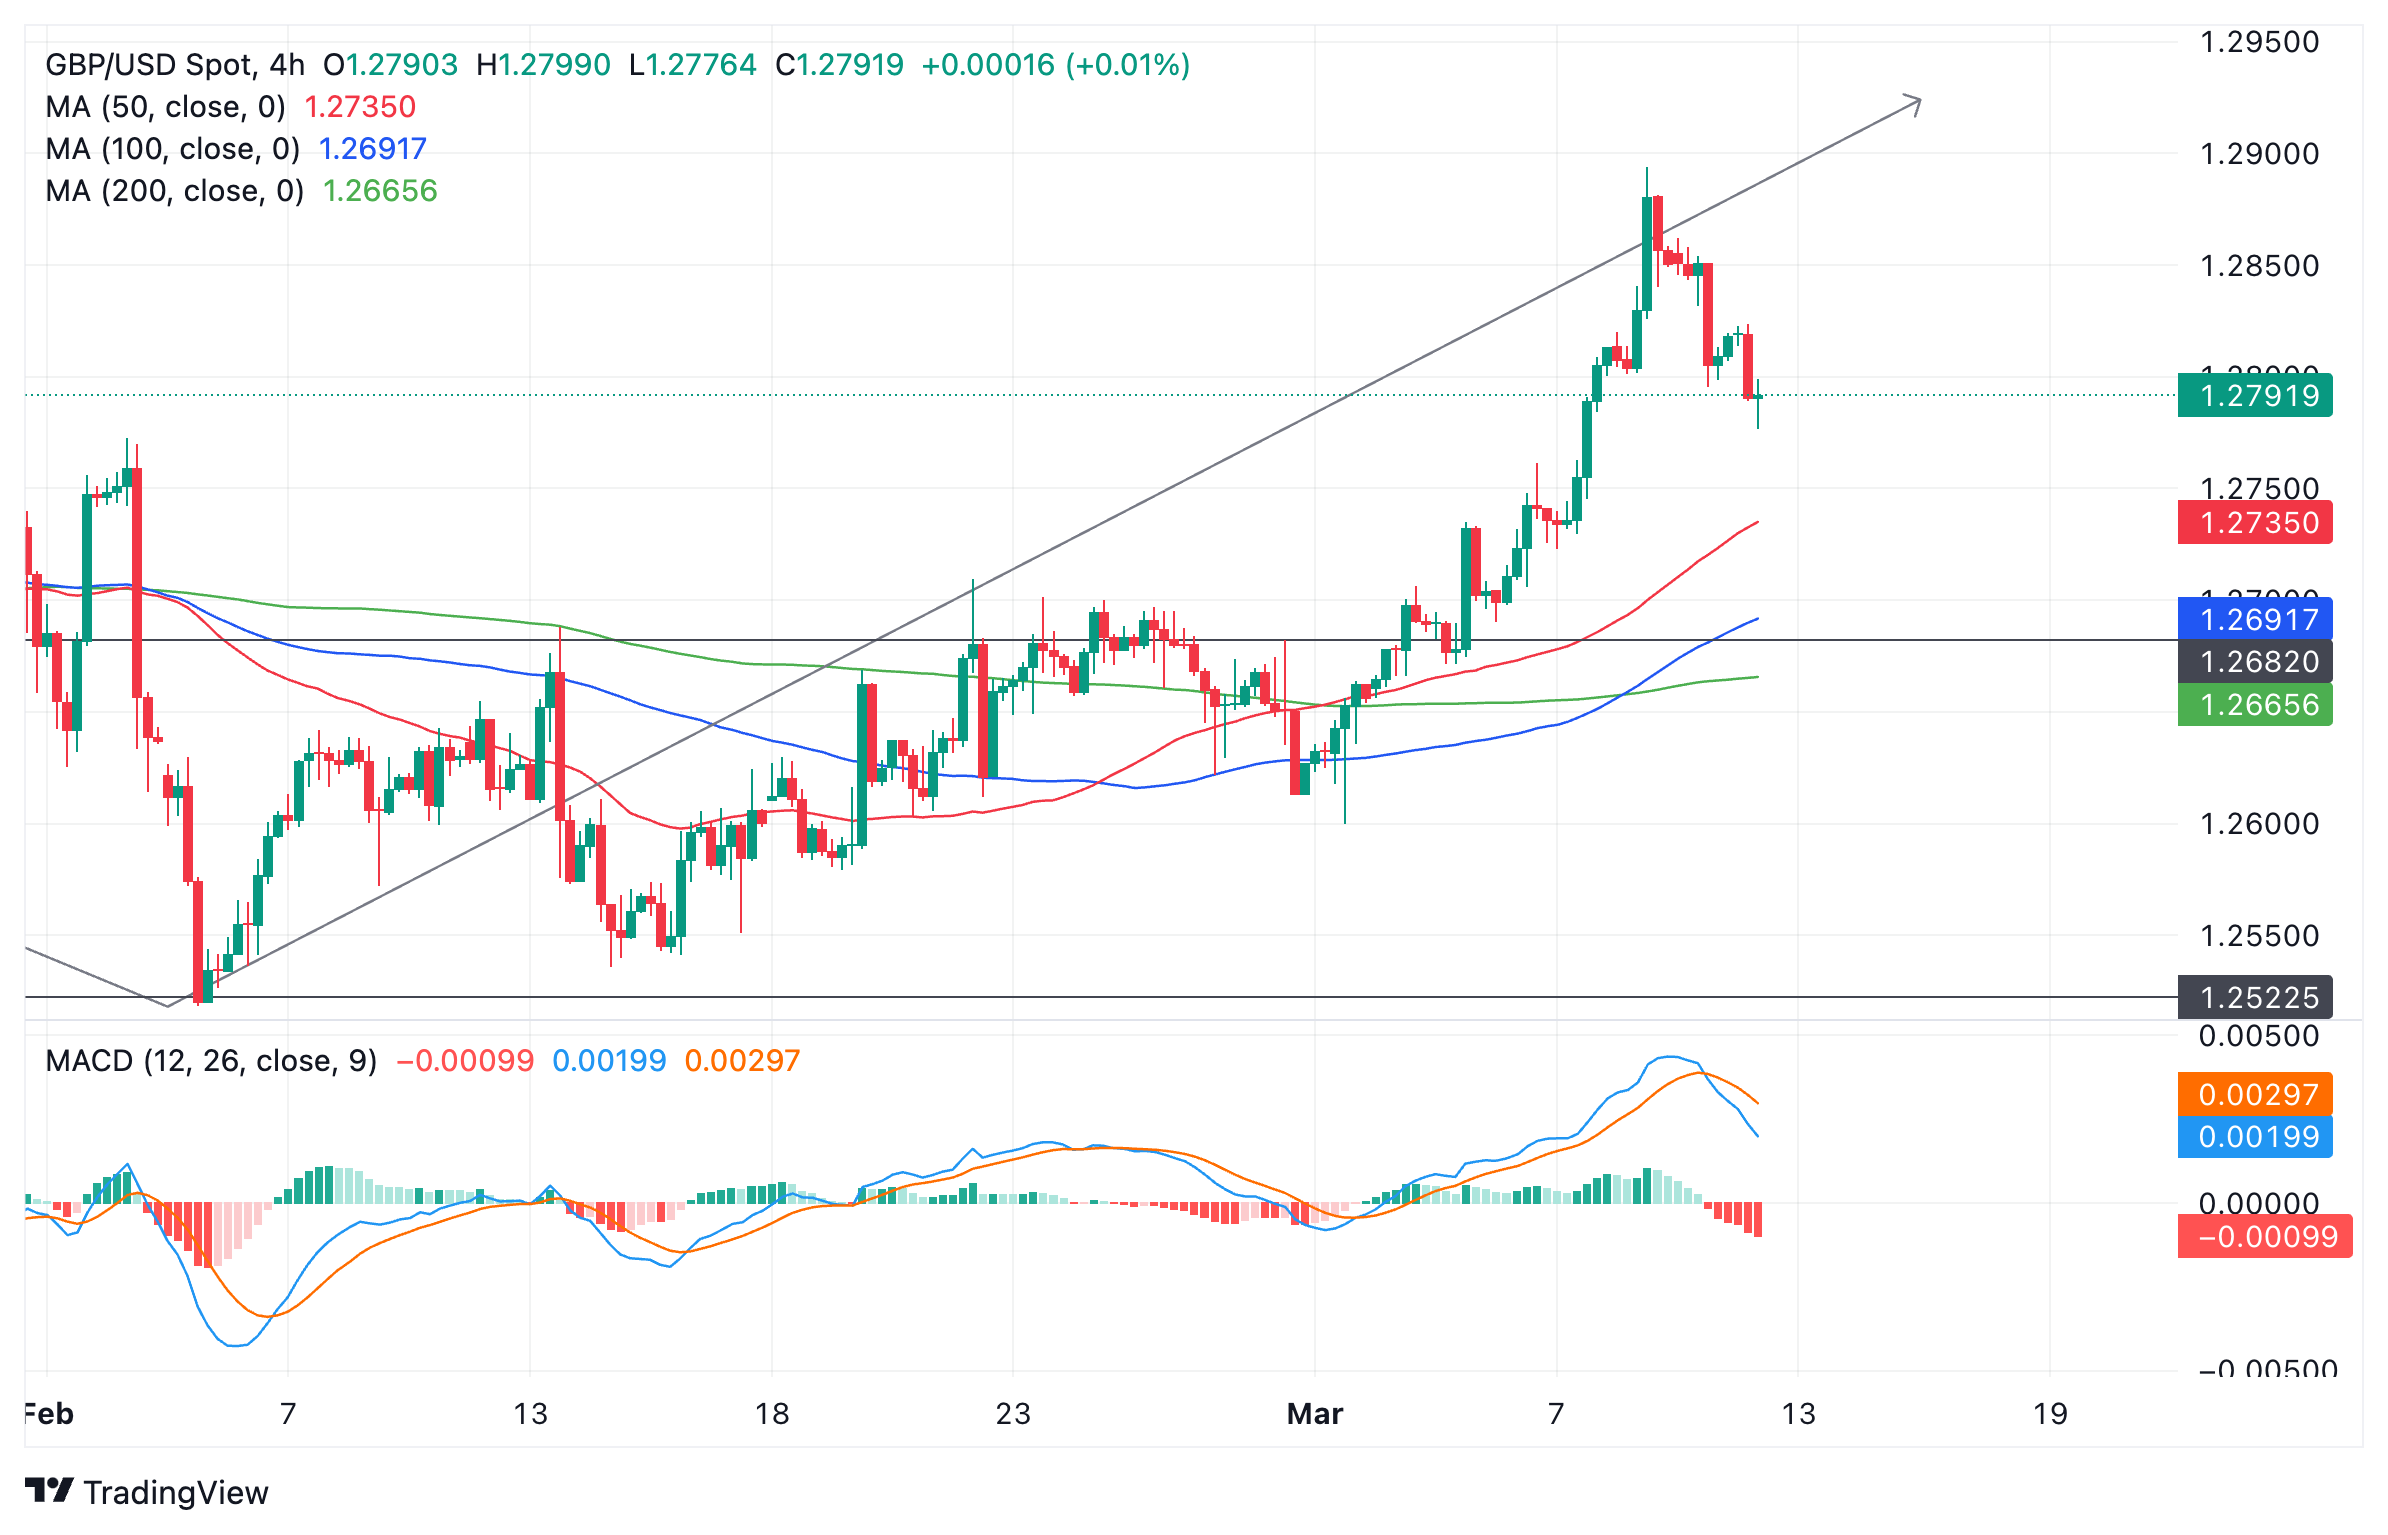
Pound Sterling vs US Dollar: 4-hour chart
GBP/USD has started to slide lower, reversing the rising peaks and troughs. The Moving Average Convergence Divergence (MACD) indicator has also crossed below its signal line offering a bearish sell signal.
The short-term uptrend is, therefore, a little in doubt, however, the fact that momentum on the way down from the March 8 peak has been slower than on the way up continues to favor a pullback rather than reversal thesis.
It is possible this pullback could continue lower to support between 1.2730 (from the 200-4hr SMA) and 1.2680, before turning around.
Traders should watch for a bullish candlestick reversal pattern or peaks and troughs climbing again for a sign the dominant uptrend is resuming. A break above 1.2860, if accompanied by strong momentum, would also suggest bulls are back in the saddle, with targets at the aforementioned ends of Wave C.
A break below 1.2720, however, would suggest the trend on a short-term basis has reversed and the pair was going lower again, probably to a target zone back in the 1.2600s where the pair was rangbound during February.


© 2000-2026. All rights reserved.
This site is managed by Teletrade D.J. LLC 2351 LLC 2022 (Euro House, Richmond Hill Road, Kingstown, VC0100, St. Vincent and the Grenadines).
The information on this website is for informational purposes only and does not constitute any investment advice.
The company does not serve or provide services to customers who are residents of the US, Canada, Iran, The Democratic People's Republic of Korea, Yemen and FATF blacklisted countries.
Making transactions on financial markets with marginal financial instruments opens up wide possibilities and allows investors who are willing to take risks to earn high profits, carrying a potentially high risk of losses at the same time. Therefore you should responsibly approach the issue of choosing the appropriate investment strategy, taking the available resources into account, before starting trading.
Use of the information: full or partial use of materials from this website must always be referenced to TeleTrade as the source of information. Use of the materials on the Internet must be accompanied by a hyperlink to teletrade.org. Automatic import of materials and information from this website is prohibited.
Please contact our PR department if you have any questions or need assistance at pr@teletrade.global.
transfers