- Analytics
- News and Tools
- Market News
- Silver Price Analysis: XAG/USD plunges to $24 after stubborn US Inflation report
Silver Price Analysis: XAG/USD plunges to $24 after stubborn US Inflation report
- Silver price falls vertically to $24 as sticky US inflation allows the Fed to maintain a hawkish narrative.
- US monthly headline and core inflation rose by 0.4% in February.
- 10-year US bond yields rally to 4.15% as hopes that Fed rate cut expectations would ease.
Silver price (XAG/USD) plummets to $24.10 as the United States Bureau of Labor Statistics (BLS) has reported that the Consumer Price Index (CPI) remains hot in February.
Annual core CPI that strips off volatile food and energy prices grew at a higher pace of 3.8% against the consensus of 3.7% but lower than 3.9% in January. In the same period, headline inflation rose at a higher pace of 3.2% against expectations and the former reading of 3.1%. The monthly headline and core inflation grew by 0.4%.
A sticky inflation report is expected to dent market expectations for the Federal Reserve (Fed) reducing interest rates in the June policy meeting. This is expected to lift up the opportunity cost of holding non-yielding assets, such as Silver. Yields on assets to which interest coupons are attached, such as US Treasury bonds, are expected to increase. 10-year US Treasury yields jump to 4.15%.
Going forward, Fed policymakers may continue to maintain a hawkish narrative. The Fed wants inflation easing for months as evidence to get convinced that price stability will be achieved. The inflation data, released yet in 2024, the last leg of stubborn inflation is a hard nut to crack.
The US Dollar Index (DXY) recovered above 103.00 on expectations that the Fed will not discuss reducing interest rates in the first half of 2024.
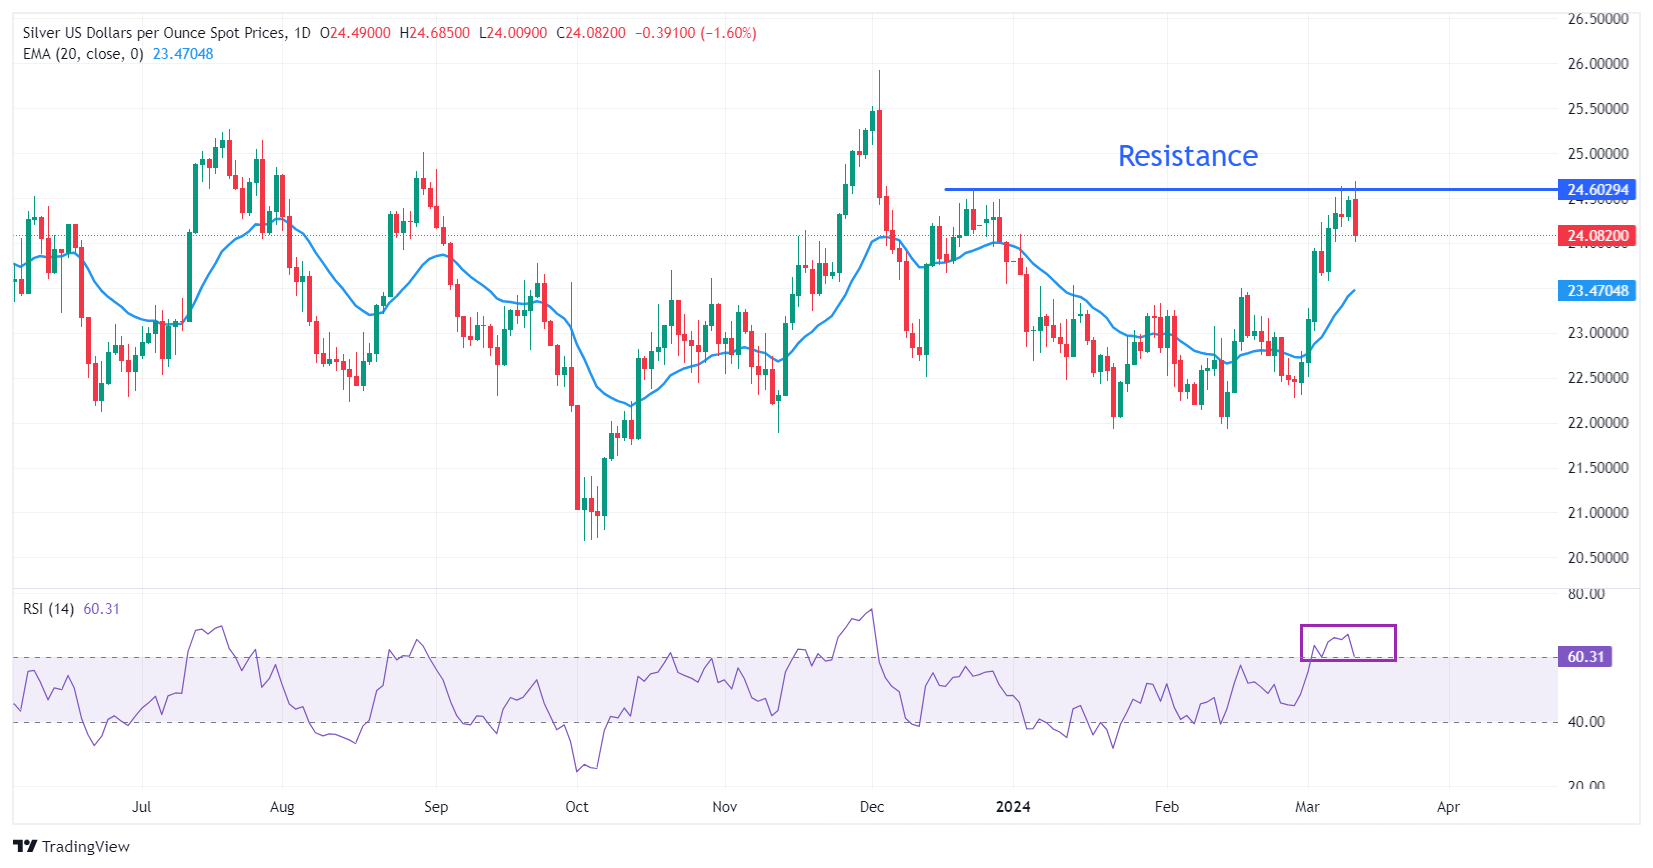
Silver technical analysis
Silver price faces selling pressure after testing the horizontal resistance plotted from the December 22 high at $24.60. The overall trend is still bullish; however, a price correction move is expected before a fresh upside move. The advancing 20-day Exponential Moving Average (EMA) near $23.50 indicates that the near-term demand is upbeat.
The 14-period Relative Strength Index (RSI) oscillates in the bullish range of 60.00-80.00, indicating that bullish momentum is active.
Silver daily chart


© 2000-2026. All rights reserved.
This site is managed by Teletrade D.J. LLC 2351 LLC 2022 (Euro House, Richmond Hill Road, Kingstown, VC0100, St. Vincent and the Grenadines).
The information on this website is for informational purposes only and does not constitute any investment advice.
The company does not serve or provide services to customers who are residents of the US, Canada, Iran, The Democratic People's Republic of Korea, Yemen and FATF blacklisted countries.
Making transactions on financial markets with marginal financial instruments opens up wide possibilities and allows investors who are willing to take risks to earn high profits, carrying a potentially high risk of losses at the same time. Therefore you should responsibly approach the issue of choosing the appropriate investment strategy, taking the available resources into account, before starting trading.
Use of the information: full or partial use of materials from this website must always be referenced to TeleTrade as the source of information. Use of the materials on the Internet must be accompanied by a hyperlink to teletrade.org. Automatic import of materials and information from this website is prohibited.
Please contact our PR department if you have any questions or need assistance at pr@teletrade.global.
transfers