- Analytics
- News and Tools
- Market News
- EUR/JPY Price Analysis: Bulls maintain dominant position, near-term might be pressure coming
EUR/JPY Price Analysis: Bulls maintain dominant position, near-term might be pressure coming
- The pair met strong resistance at the 20-day SMA, which in case of conquering it, will confirm a bullish bias.
- The daily chart indicators suggest a strengthening upward momentum with the RSI jumping above 50.
- The hourly RSI hovers in the overbought territory, a potential sign of short-term buyer exhaustion.
In Friday's session, EUR/JPY trades with gains at 162.27, marking a 0.54% rise in attempting to conquer the 20-day Simple Moving Average (SMA). The bulls seemingly hold a strong grip, as the buying momentum appears to intensify. Yet, the sellers might come into action as the indicators flash overbought signs on the hourly signs.
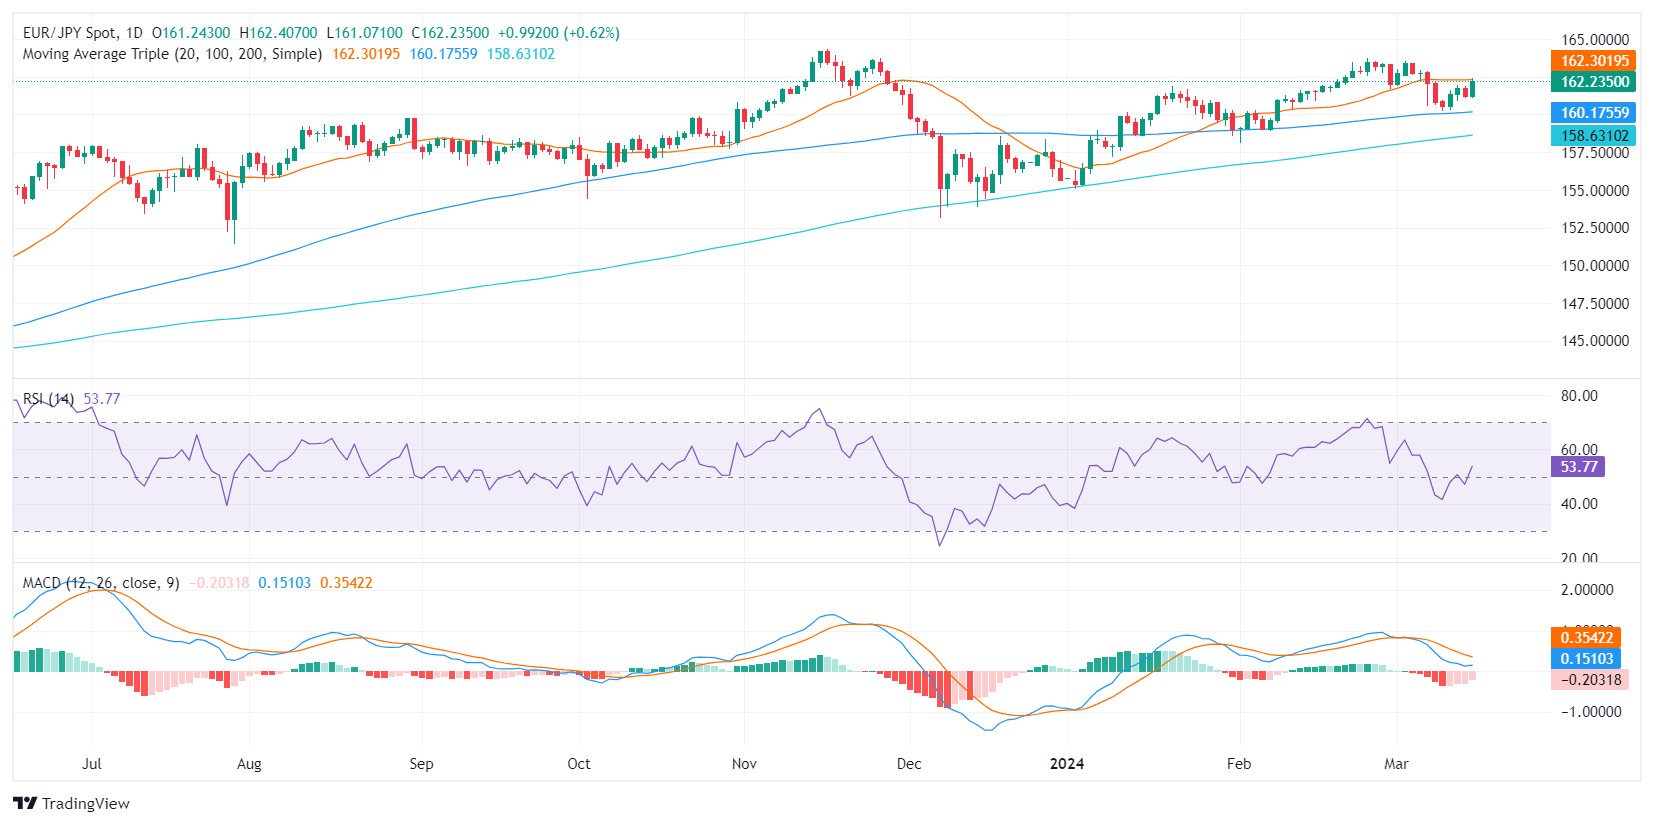
Based on the indicators of the daily chart for the EUR/JPY pair, the Relative Strength Index (RSI) has moved into positive territory, suggesting a stronger upward momentum. Meanwhile, the downturn of the Moving Average Convergence Divergence (MACD) histogram prints shortening red bars, arguing in favor of a stronger bullish grip.
EUR/JPY daily chart
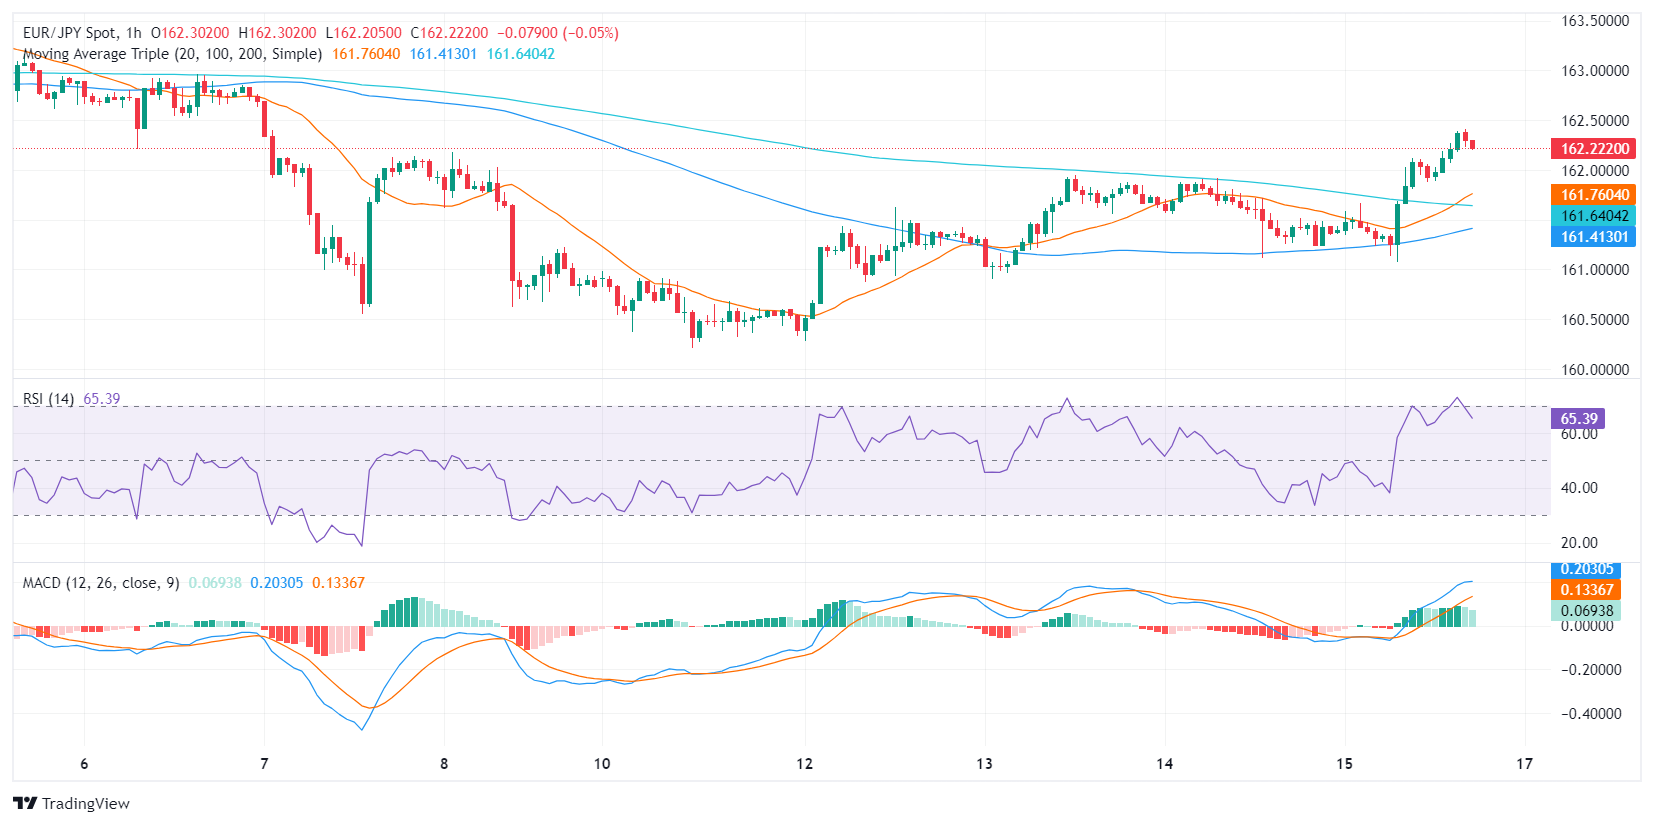
Turning to the hourly chart, the RSI seems to be hovering in the overbought territory. Despite a strong upward trend, this indicates potential exhaustion from the buyers. Similarly, the MACD's decreasing green bars might be signaling a shift in the tide, turning favor towards sellers for the short-term period.
EUR/JPY hourly chart
Given that the pair remains above the 100- and 200-day SMAs, yet below the 20-day SMA, it gives mixed signals regarding the broader market control. Thus, an interplay of daily and hourly charts suggests an uphill battle with the bulls maintaining control in a larger context, albeit facing potential near-term pressures.


© 2000-2026. All rights reserved.
This site is managed by Teletrade D.J. LLC 2351 LLC 2022 (Euro House, Richmond Hill Road, Kingstown, VC0100, St. Vincent and the Grenadines).
The information on this website is for informational purposes only and does not constitute any investment advice.
The company does not serve or provide services to customers who are residents of the US, Canada, Iran, The Democratic People's Republic of Korea, Yemen and FATF blacklisted countries.
Making transactions on financial markets with marginal financial instruments opens up wide possibilities and allows investors who are willing to take risks to earn high profits, carrying a potentially high risk of losses at the same time. Therefore you should responsibly approach the issue of choosing the appropriate investment strategy, taking the available resources into account, before starting trading.
Use of the information: full or partial use of materials from this website must always be referenced to TeleTrade as the source of information. Use of the materials on the Internet must be accompanied by a hyperlink to teletrade.org. Automatic import of materials and information from this website is prohibited.
Please contact our PR department if you have any questions or need assistance at pr@teletrade.global.
transfers