- Analytics
- News and Tools
- Market News
- NZD/JPY Price Analysis: Bears maintain control, despite recent bullish resurgence
NZD/JPY Price Analysis: Bears maintain control, despite recent bullish resurgence
- On the daily chart, sellers remain in control despite the improvement of the RSI and MACD.
- While the daily chart emits bearish signals, the hourly indicators provide a more balanced picture, showcasing an equilibrium between buyers and sellers.
- The cross saw a recovery during the American session and managed to clear daily losses.
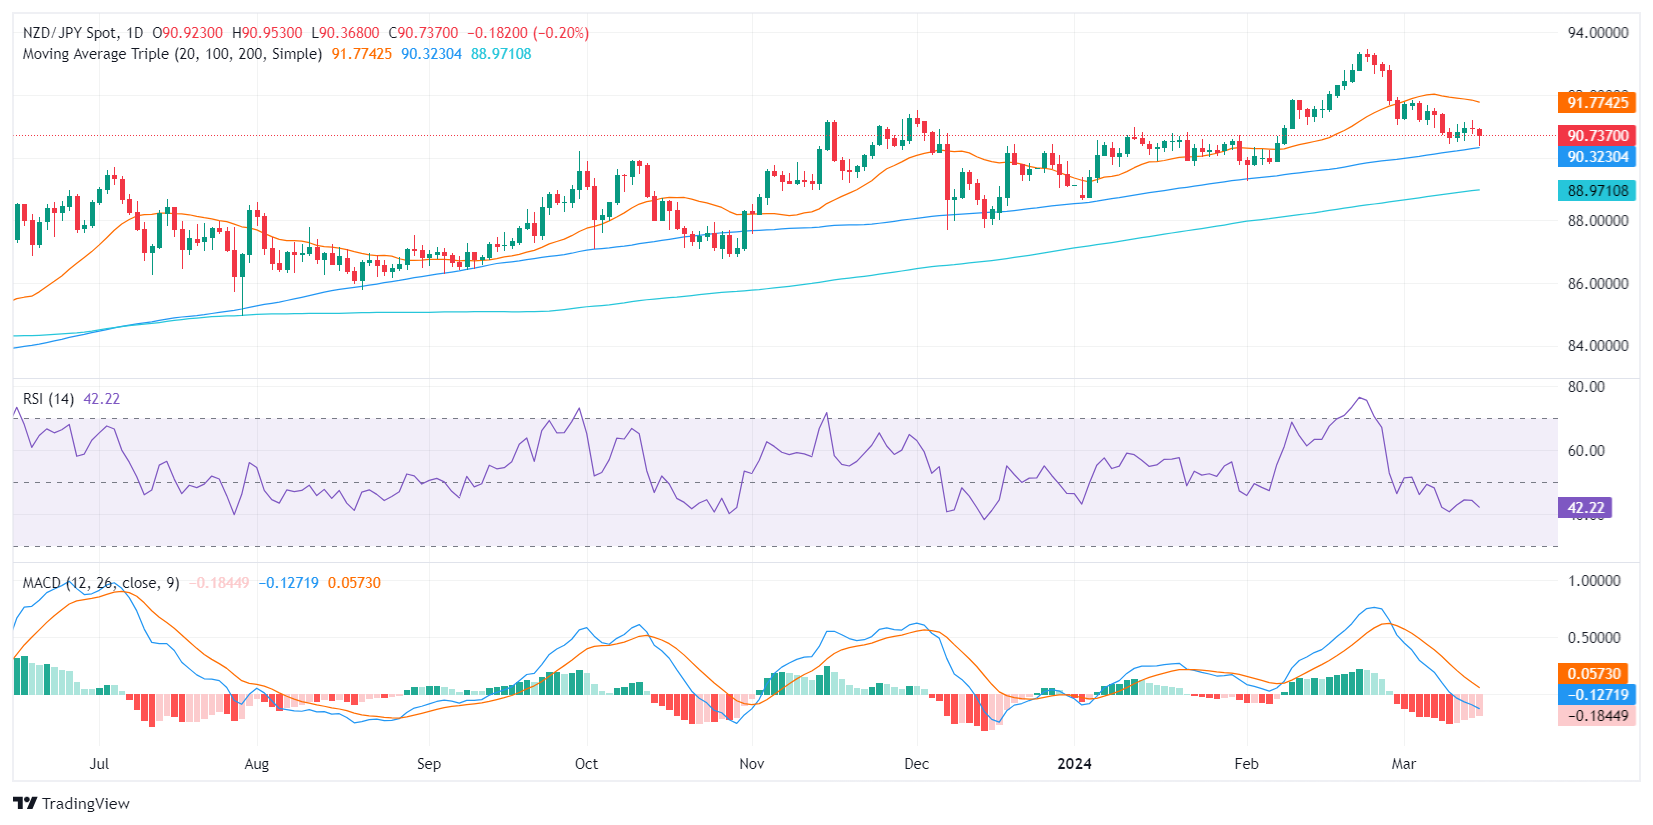
In Friday's session, the NZD/JPY is trading at 90.70, recording a slight loss of 0.22% after bottoming at a low of 90.35. The positioning of the pair above the key 100 and 200-day Simple Moving Averages (SMAs) might hint at bullish prospects in the overall trend, yet the shorter technical outlook tilts toward the bears as it trades below the 20-day average.
On the daily chart, the NZD/JPY's Relative Strength Index (RSI) has been in negative territory, signaling that sellers have been dominant. The Moving Average Convergence Divergence (MACD) doesn't present any brighter picture either. Its histogram has flat red bars, indicating negative momentum and a lack of buying strength.
NZD/JPY daily chart
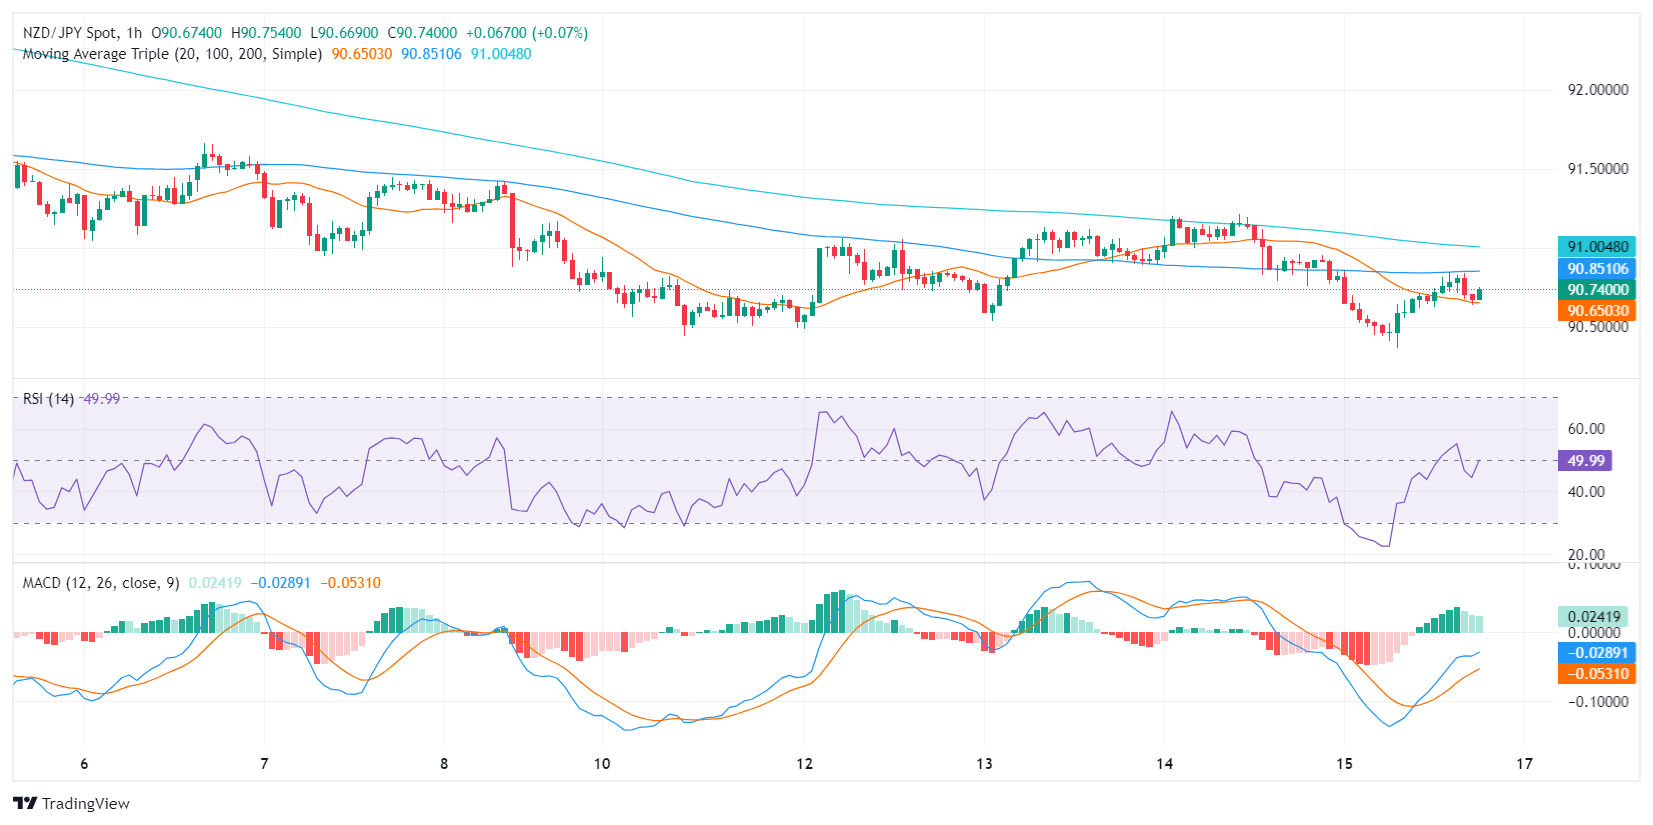
Switching to the hourly chart, the RSI recovered towards 50, the neutral level, suggesting a balance between buyers and sellers. On the other hand, the MACD histogram displays flat green bars, indicating a steady positive momentum.
NZD/JPY hourly chart
To conclude, the broader daily analysis paints a reasonably bearish picture, with the RSI and MACD indicating seller dominance and the pair below the 20-day SMA. Yet, the hourly chart presents a somewhat mixed picture, showing a balance between buyers and sellers. Considering the pair's position above the 100 and 200-day SMAs, despite the immediate bearish sentiment, the bulls might still have a chance to regain control.


© 2000-2026. All rights reserved.
This site is managed by Teletrade D.J. LLC 2351 LLC 2022 (Euro House, Richmond Hill Road, Kingstown, VC0100, St. Vincent and the Grenadines).
The information on this website is for informational purposes only and does not constitute any investment advice.
The company does not serve or provide services to customers who are residents of the US, Canada, Iran, The Democratic People's Republic of Korea, Yemen and FATF blacklisted countries.
Making transactions on financial markets with marginal financial instruments opens up wide possibilities and allows investors who are willing to take risks to earn high profits, carrying a potentially high risk of losses at the same time. Therefore you should responsibly approach the issue of choosing the appropriate investment strategy, taking the available resources into account, before starting trading.
Use of the information: full or partial use of materials from this website must always be referenced to TeleTrade as the source of information. Use of the materials on the Internet must be accompanied by a hyperlink to teletrade.org. Automatic import of materials and information from this website is prohibited.
Please contact our PR department if you have any questions or need assistance at pr@teletrade.global.
transfers