- Analytics
- News and Tools
- Market News
- EUR/JPY Price Analysis: Buyers maintain stronghold, impending overbought conditions signal possible downturn
EUR/JPY Price Analysis: Buyers maintain stronghold, impending overbought conditions signal possible downturn
- The EUR/JPY rallied in Tuesday’s session, seeing more than 1% gains.
- The daily RSI reveals growing buying momentum, deep in positive territory.
- The hourly chart hints at overbought conditions, and the RSI staying above 70 signals the potential for profit-taking sell-offs.
In Tuesday's session, the EUR/JPY pair is trading around the 164.00 region, marking a strong rally of 1.14%. The daily outlook is tilting in favor of the buyers while overbought conditions seen on the hourly chart suggest that consolidation is on the horizon.
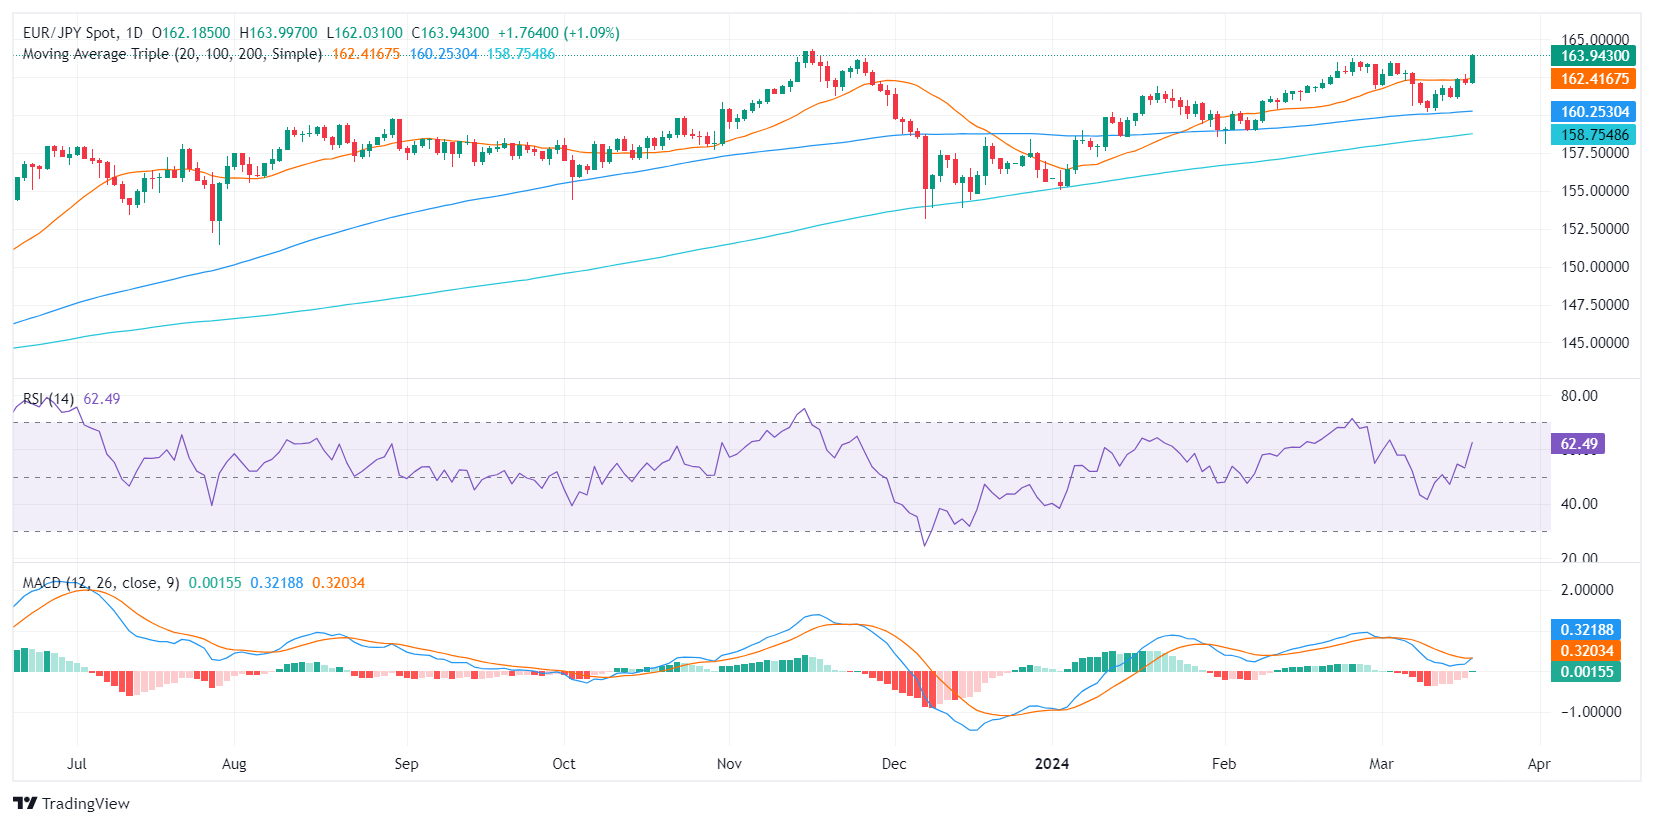
On the daily chart, the pair exhibits increasing momentum, as indicated by the latest Relative Strength Index (RSI) values. Moving from negative territory, the recent RSI trajectory consolidated in positive territory, lately peaking at 65 which is approaching overbought status. Currently, buyers dominate the market, leading to the possibility of the pair moving into overbought conditions soon.
EUR/JPY daily chart
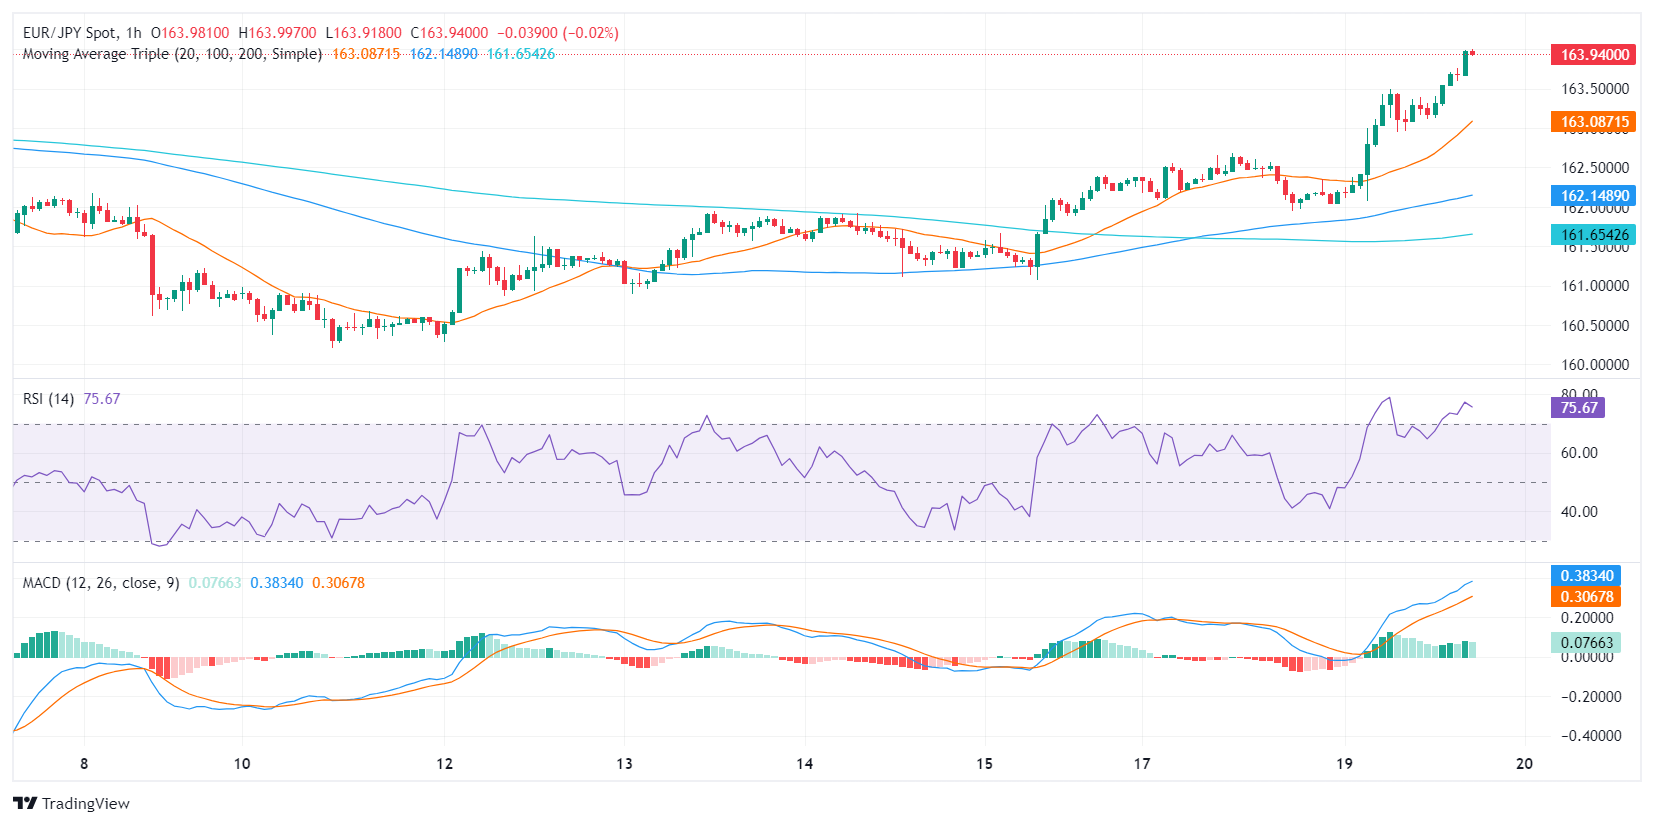
When examining the hourly chart, the EUR/JPY pair displays persistent overbought conditions. The RSI values consistently stay strong and above 70 which suggests intense buying pressure. The Moving Average Convergence Divergence (MACD) reinforces this bullish momentum with its rising green bars. However, these overbought conditions might soon provoke a downward correction as overbuying could lead to profit-taking sell-offs.
EUR/JPY hourly chart
Conclusively, both the daily and hourly charts indicate robust buying momentum. The positive outlook is further corroborated by the pair trading above the main Simple Moving Averages (SMAs) of 20, 100, and 200 days. Any downward correction which keeps the pair above these levels, won’t affect the overall bullish trend.


© 2000-2026. All rights reserved.
This site is managed by Teletrade D.J. LLC 2351 LLC 2022 (Euro House, Richmond Hill Road, Kingstown, VC0100, St. Vincent and the Grenadines).
The information on this website is for informational purposes only and does not constitute any investment advice.
The company does not serve or provide services to customers who are residents of the US, Canada, Iran, The Democratic People's Republic of Korea, Yemen and FATF blacklisted countries.
Making transactions on financial markets with marginal financial instruments opens up wide possibilities and allows investors who are willing to take risks to earn high profits, carrying a potentially high risk of losses at the same time. Therefore you should responsibly approach the issue of choosing the appropriate investment strategy, taking the available resources into account, before starting trading.
Use of the information: full or partial use of materials from this website must always be referenced to TeleTrade as the source of information. Use of the materials on the Internet must be accompanied by a hyperlink to teletrade.org. Automatic import of materials and information from this website is prohibited.
Please contact our PR department if you have any questions or need assistance at pr@teletrade.global.
transfers