- Analytics
- News and Tools
- Market News
- NZD/USD Price Analysis: Bears remain in control, yet the hourly chart hints at easing sell-off pressure
NZD/USD Price Analysis: Bears remain in control, yet the hourly chart hints at easing sell-off pressure
- The daily chart of NZD/USD presents a bearish outlook with the RSI and MACD deep in the red zone.
- On the hourly chart, the selling pressure is easing.
- The NZD/USD is operating below the main SMAs, indicating a persisting bearish bias.
The NZD/USD pair registered a decline of 0.54%, falling towards 0.6050 in Tuesday's session. Earlier in the session, indicators reached oversold conditions on the hourly chart, and ahead of the Asian session, the pair seems to be consolidating
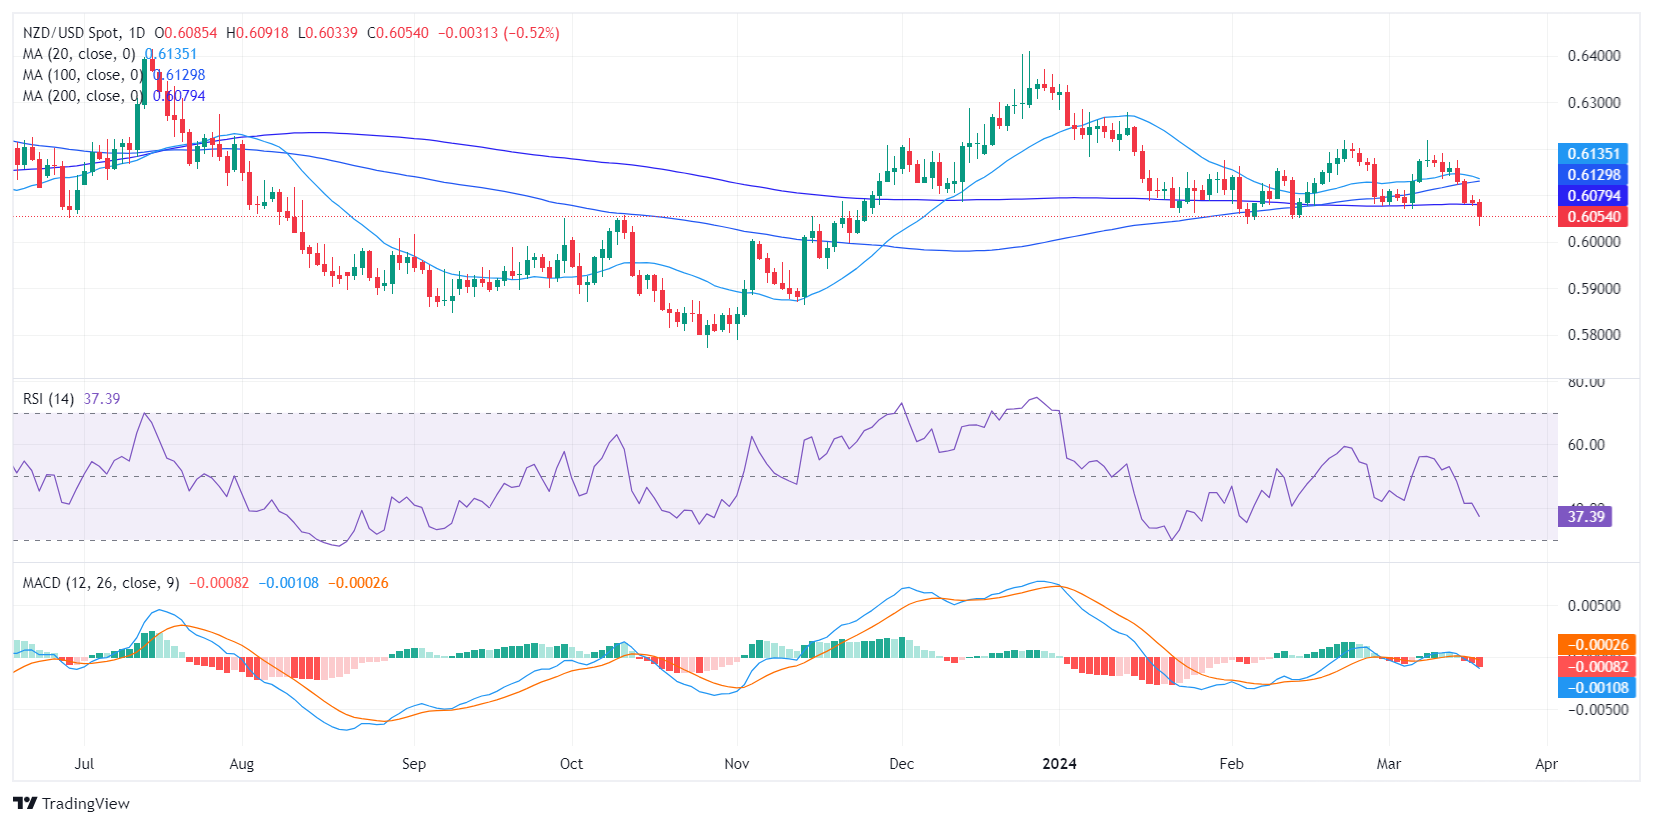
On the daily chart, the pair is facing intense selling pressure, as indicated by the declining Relative Strength Index (RSI). The latest reading stands at 36, situated in the negative territory and nearing the oversold threshold, suggesting that sellers currently dominate the market. The Moving Average Convergence Divergence (MACD) also confirms this bearish sentiment, with its rising red bars indicating mounting negative momentum.
NZD/USD daily chart
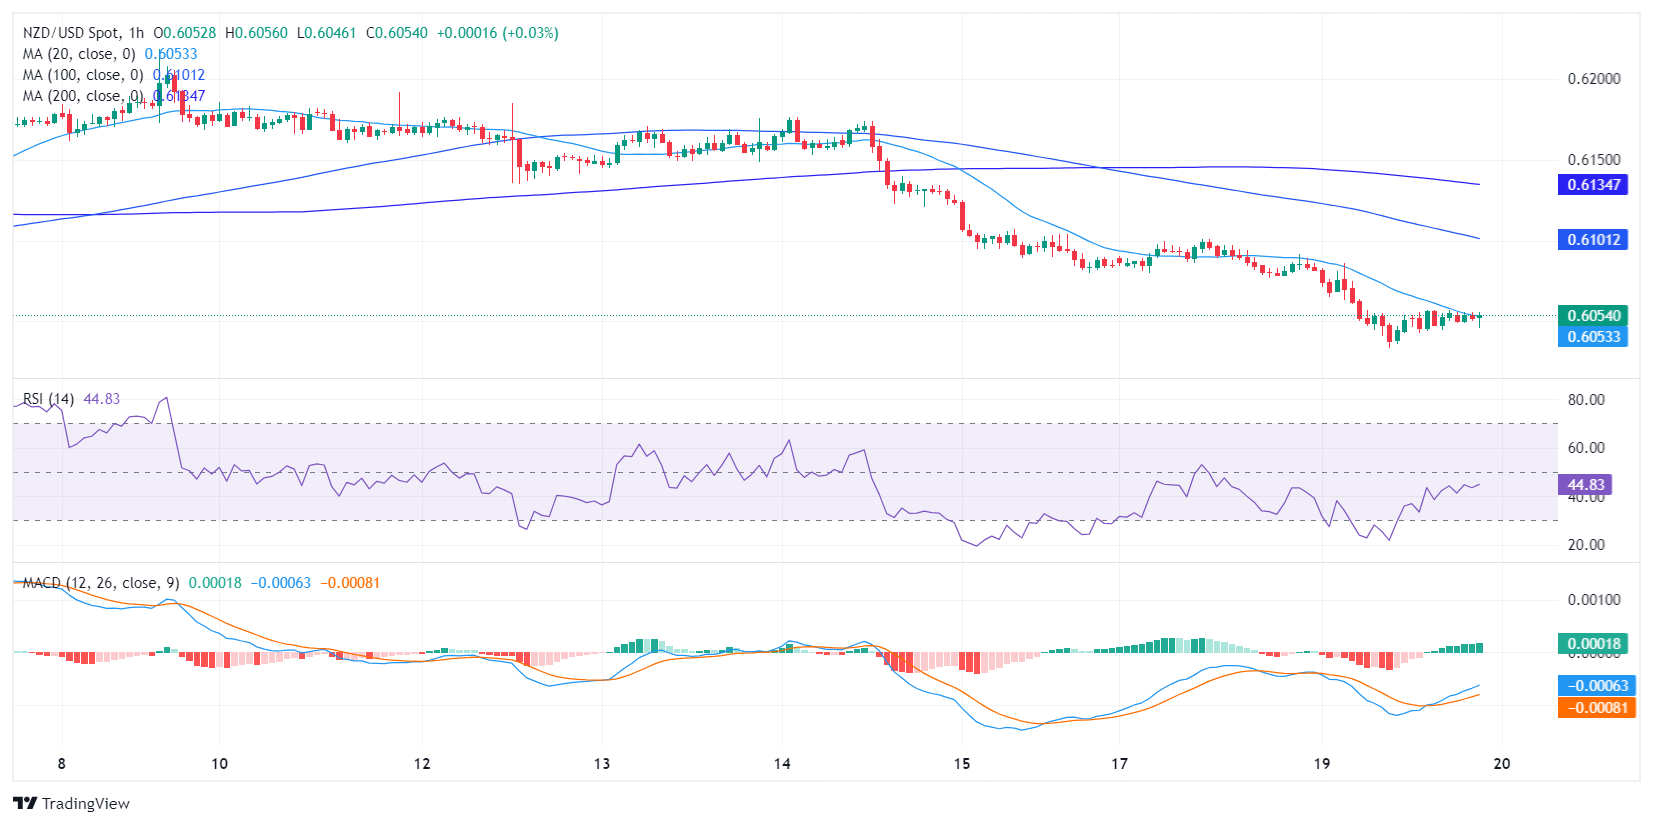
On the hourly chart, however, the picture differs. The RSI readings appear to fluctuate within the negative territory, with the last reading measured at 42, slightly higher than the reading on the daily chart, denoting tempered selling pressure after bottoming at a low of 22 earlier in the session. Here, the MACD shows a declining selling pressure.
NZD/USD hourly chart
On a broader scale, the trend is still bearish as the pair continues to trade below its 20, 100, and 200-day Simple Moving Averages (SMAs).


© 2000-2026. All rights reserved.
This site is managed by Teletrade D.J. LLC 2351 LLC 2022 (Euro House, Richmond Hill Road, Kingstown, VC0100, St. Vincent and the Grenadines).
The information on this website is for informational purposes only and does not constitute any investment advice.
The company does not serve or provide services to customers who are residents of the US, Canada, Iran, The Democratic People's Republic of Korea, Yemen and FATF blacklisted countries.
Making transactions on financial markets with marginal financial instruments opens up wide possibilities and allows investors who are willing to take risks to earn high profits, carrying a potentially high risk of losses at the same time. Therefore you should responsibly approach the issue of choosing the appropriate investment strategy, taking the available resources into account, before starting trading.
Use of the information: full or partial use of materials from this website must always be referenced to TeleTrade as the source of information. Use of the materials on the Internet must be accompanied by a hyperlink to teletrade.org. Automatic import of materials and information from this website is prohibited.
Please contact our PR department if you have any questions or need assistance at pr@teletrade.global.
transfers