- Analytics
- News and Tools
- Market News
- AUD/JPY Price Analysis: Gains momentum below the 99.00 mark amid the overbought condition
AUD/JPY Price Analysis: Gains momentum below the 99.00 mark amid the overbought condition
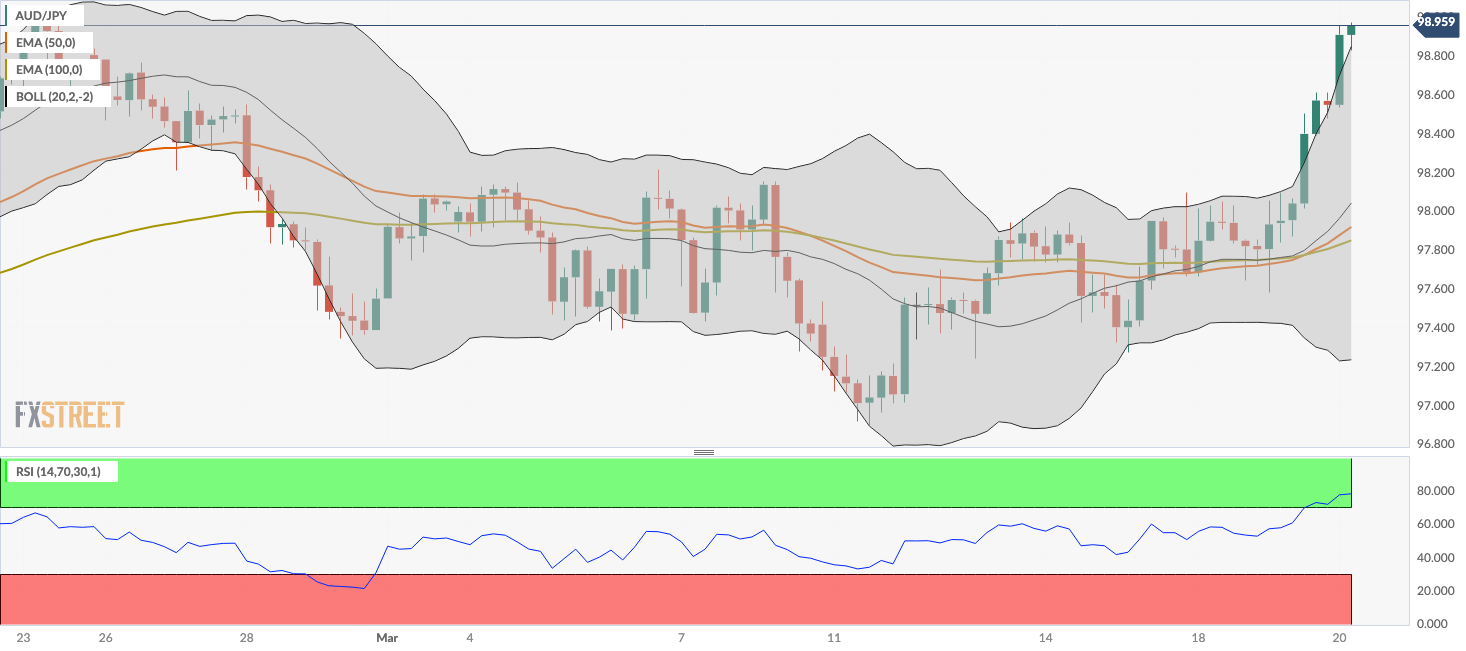
- AUD/JPY attracts some buyers around 98.95 in Wednesday’s early European session.
- The cross resumes its bullish outlook with the overbought RSI condition.
- The first upside barrier is located in the 99.00–99.05 region; 98.10 acts as an initial support level.
The AUD/JPY cross gains traction below the 99.00 psychological barrier during the early European trading hours on Wednesday. The decline of the Japanese Yen (JPY) to a multi-month low following the Bank of Japan’s (BoJ) dovish hike on Tuesday creates a tailwind for the cross. At the press time, the cross is trading at 98.95, up 0.43% on the day.
Technically, AUD/JPY keeps the bullish vibe unchanged as the cross is above the key 100-period Exponential Moving Averages (EMAs) on the four-hour chart. The Relative Strength Index (RSI) holds in bullish territory above the 50 midline. However, the overbought RSI condition indicates that further consolidation cannot be ruled out before positioning for any near-term AUD/JPY appreciation.
The first upside barrier for the cross will emerge at the 99.00–99.05 zone, representing a high of February 23 and a round figure. The key hurdle is seen at the psychological round mark of 100.00. Further north, the next upstate target is located near a weekly low of May 10, 2013 at 100.40.
On the other hand, a high of March 17 at 98.10 acts as an initial support level for AUD/JPY. The next contention level to watch is the 100-period EMA at 97.85. Any follow-through selling below the latter will resume the downside and drag the cross lower to a low of March 18 at 97.65, followed by the lower limit of the Bollinger Band at 97.24.
AUD/JPY four-hour chart


© 2000-2026. All rights reserved.
This site is managed by Teletrade D.J. LLC 2351 LLC 2022 (Euro House, Richmond Hill Road, Kingstown, VC0100, St. Vincent and the Grenadines).
The information on this website is for informational purposes only and does not constitute any investment advice.
The company does not serve or provide services to customers who are residents of the US, Canada, Iran, The Democratic People's Republic of Korea, Yemen and FATF blacklisted countries.
Making transactions on financial markets with marginal financial instruments opens up wide possibilities and allows investors who are willing to take risks to earn high profits, carrying a potentially high risk of losses at the same time. Therefore you should responsibly approach the issue of choosing the appropriate investment strategy, taking the available resources into account, before starting trading.
Use of the information: full or partial use of materials from this website must always be referenced to TeleTrade as the source of information. Use of the materials on the Internet must be accompanied by a hyperlink to teletrade.org. Automatic import of materials and information from this website is prohibited.
Please contact our PR department if you have any questions or need assistance at pr@teletrade.global.
transfers