- Analytics
- News and Tools
- Market News
- NZD/JPY Price Analysis: Bulls are firmly in control according to daily trends, houly indicators consolidate
NZD/JPY Price Analysis: Bulls are firmly in control according to daily trends, houly indicators consolidate
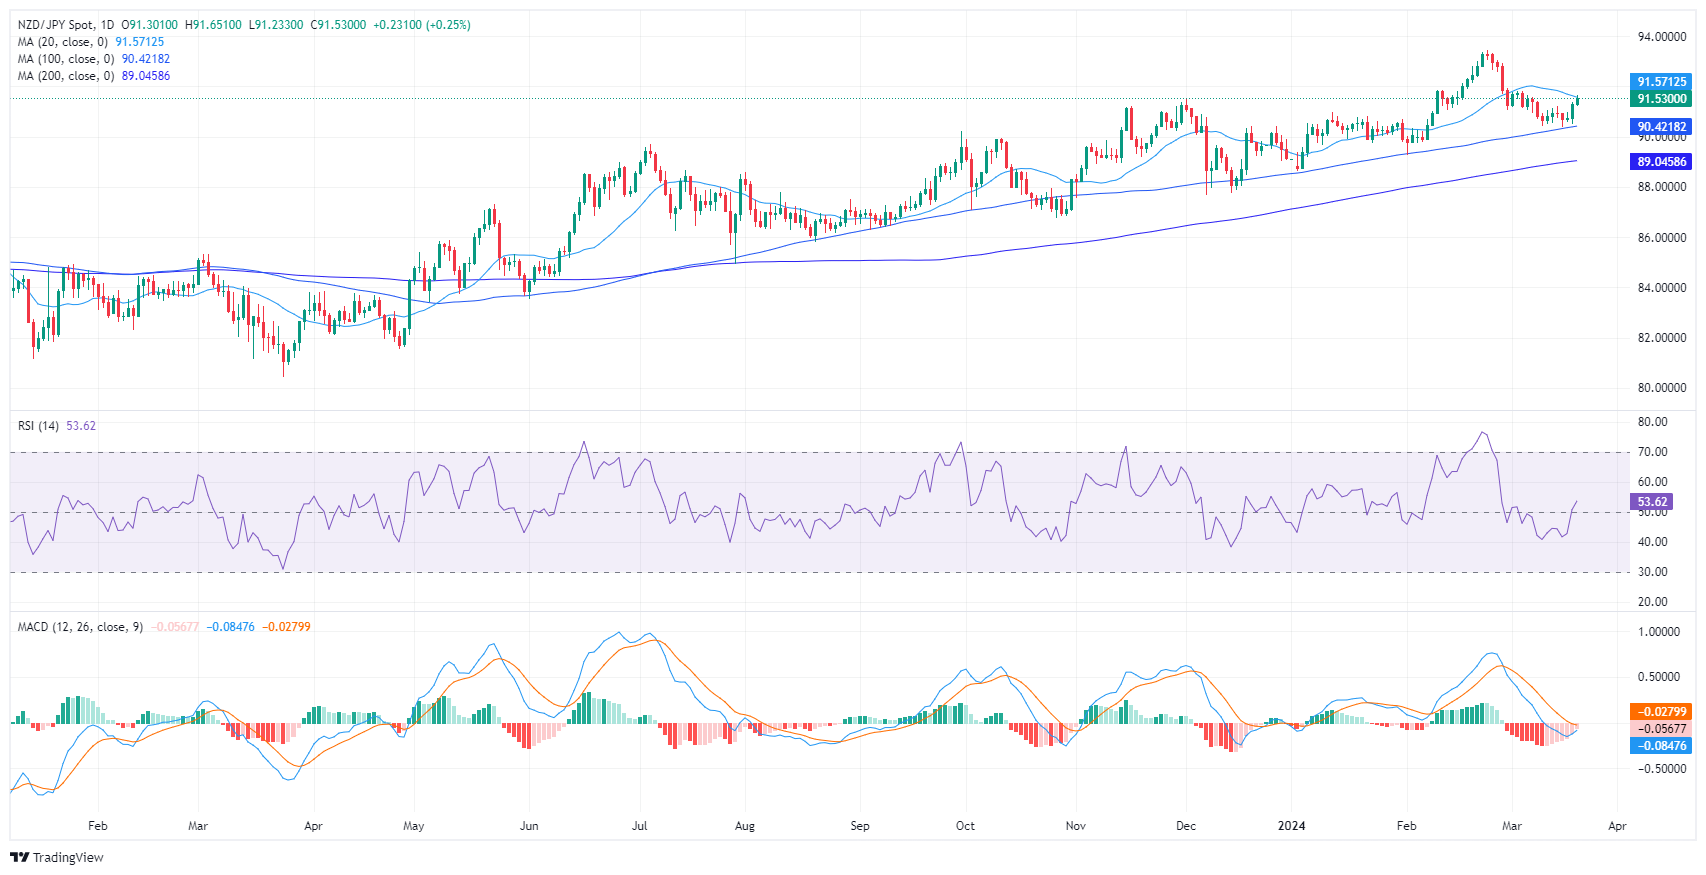
- The daily chart reveals bullish sentiment, with RSI on an upward trajectory out of the negative zone and MACD depicting decreasing red bars.
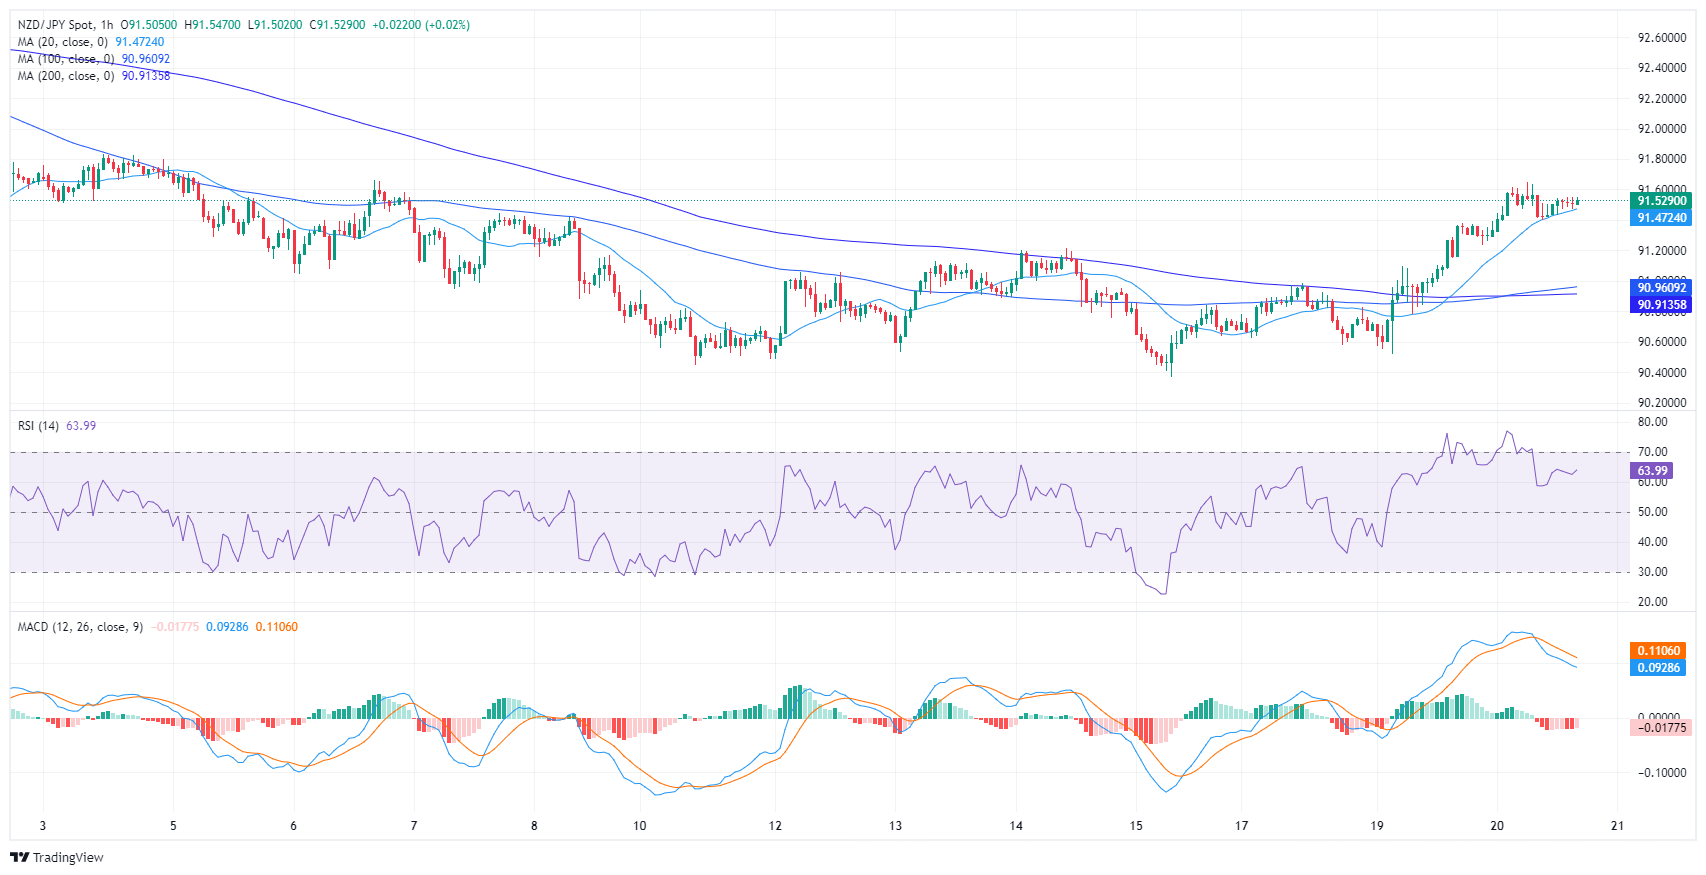
- Indicators are consolidating overbought conditions on the hourly chart.
- Bulls must recover the 20-day SMA to confirm a recovery.
The NZD/JPY currency pair is trading at 91.54, showing gains in Wednesday's session. The broader technical landscape suggests the buyers. Despite recent bearish activity pushing the pair below the 20-day Simple Moving Averages (SMAs), the pair remains aloft of the 100 and 200-day SMAs, indicating an enduring bullish control.
On the daily chart, the NZD/JPY pair exhibits relatively bullish momentum. The Relative Strength Index (RSI) indicates a positive trend with an upward slope, moving above the negative territory. This, combined with the decreasing red bars from the Moving Average Convergence Divergence (MACD) which indicates declining negative momentum, suggests the buyers are gaining the upper hand over sellers.
NZD/JPY Daily Chart
Transitioning to the hourly chart for the NZD/JPY presents a slightly different scenario. Here, the RSI consistently indicates positive with minor fluctuations, hinting at strong buying momentum but consolidating after entering in the overbought area during the European session. Meanwhile, the MACD reveals flat red bars, signifying stagnant negative momentum suggesting that the buyers are gearing up for the next upward leg.
NZD/JPY Hourly Chart


© 2000-2026. All rights reserved.
This site is managed by Teletrade D.J. LLC 2351 LLC 2022 (Euro House, Richmond Hill Road, Kingstown, VC0100, St. Vincent and the Grenadines).
The information on this website is for informational purposes only and does not constitute any investment advice.
The company does not serve or provide services to customers who are residents of the US, Canada, Iran, The Democratic People's Republic of Korea, Yemen and FATF blacklisted countries.
Making transactions on financial markets with marginal financial instruments opens up wide possibilities and allows investors who are willing to take risks to earn high profits, carrying a potentially high risk of losses at the same time. Therefore you should responsibly approach the issue of choosing the appropriate investment strategy, taking the available resources into account, before starting trading.
Use of the information: full or partial use of materials from this website must always be referenced to TeleTrade as the source of information. Use of the materials on the Internet must be accompanied by a hyperlink to teletrade.org. Automatic import of materials and information from this website is prohibited.
Please contact our PR department if you have any questions or need assistance at pr@teletrade.global.
transfers