- Analytics
- News and Tools
- Market News
- EUR/JPY Price Analysis: Bullish momentum upheld, short-term market correction on the horizon
EUR/JPY Price Analysis: Bullish momentum upheld, short-term market correction on the horizon
- The daily RSI was rejected near the overbought region.
- Hourly chart indicators show a shift in short-term dynamics, with sellers gaining ground.
- Despite the signs of potential short-term bearish correction, the pair still holds above key SMAs, denoting an overall bullish trend.
The EUR/JPY pair shows slight losses of 0.26% during Thursday's session. Despite sporadic fluctuations, there is a largely upward trend, indicating a strong position for buyers. Yet, recent subtle signs of selling pressure hint at a potential challenge to the continuity of the bullish trend for the next sessions.
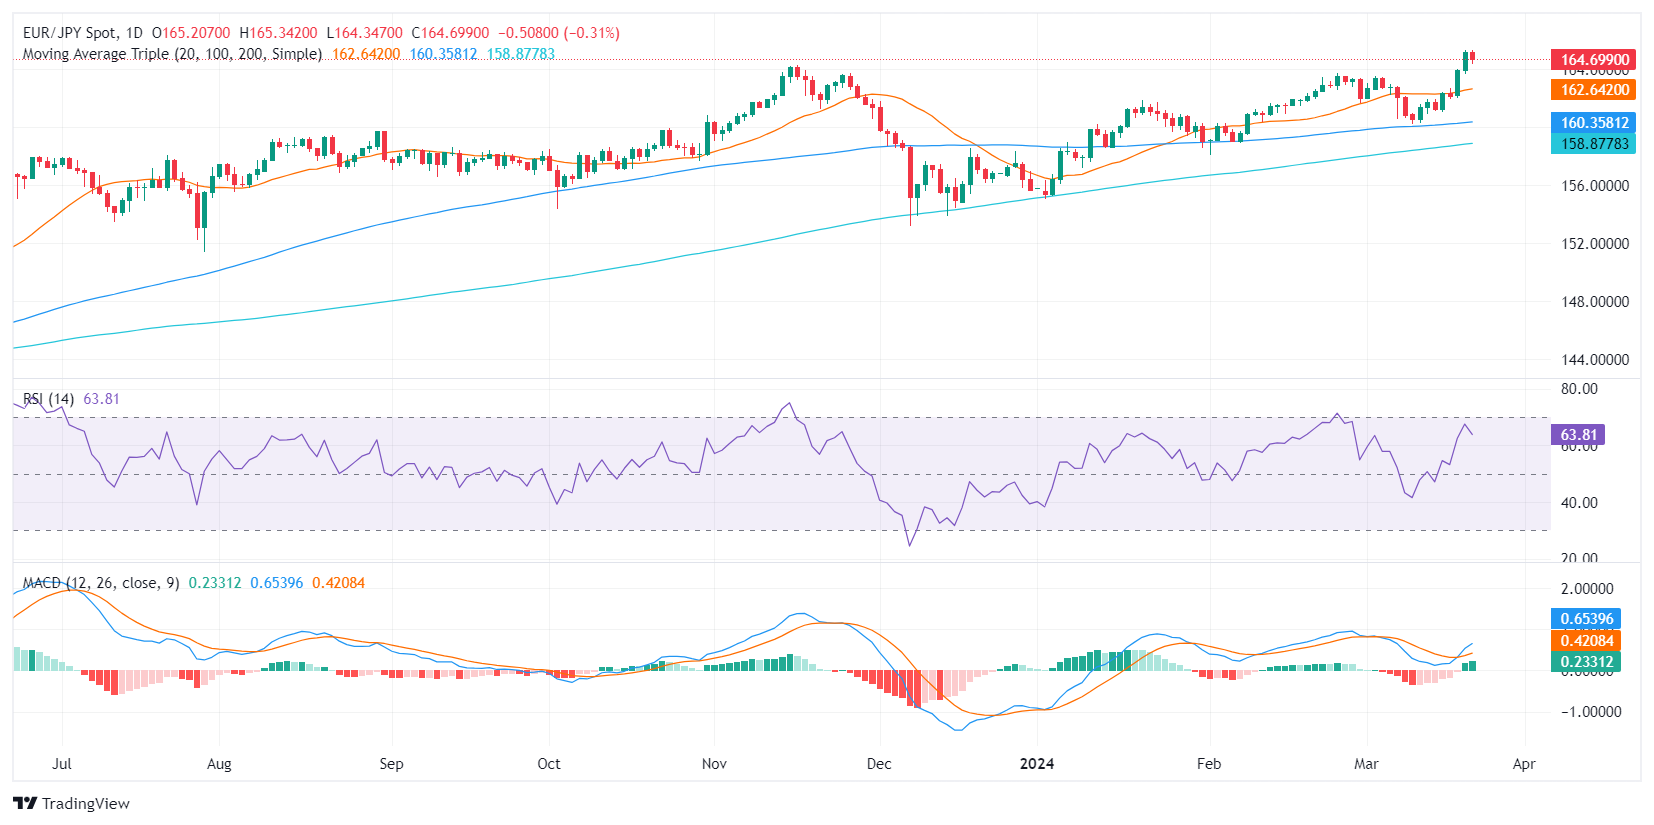
On the daily chart, the Relative Strength Index (RSI) shows an overall positive trend. However, imminent overbought conditions suggest a possible downward retracement could soon emerge as buyers may continue taking profits. In addition, the Moving Average Convergence Divergence (MACD) continues to print green bars, suggesting a steady buying momentum
EUR/JPY daily chart
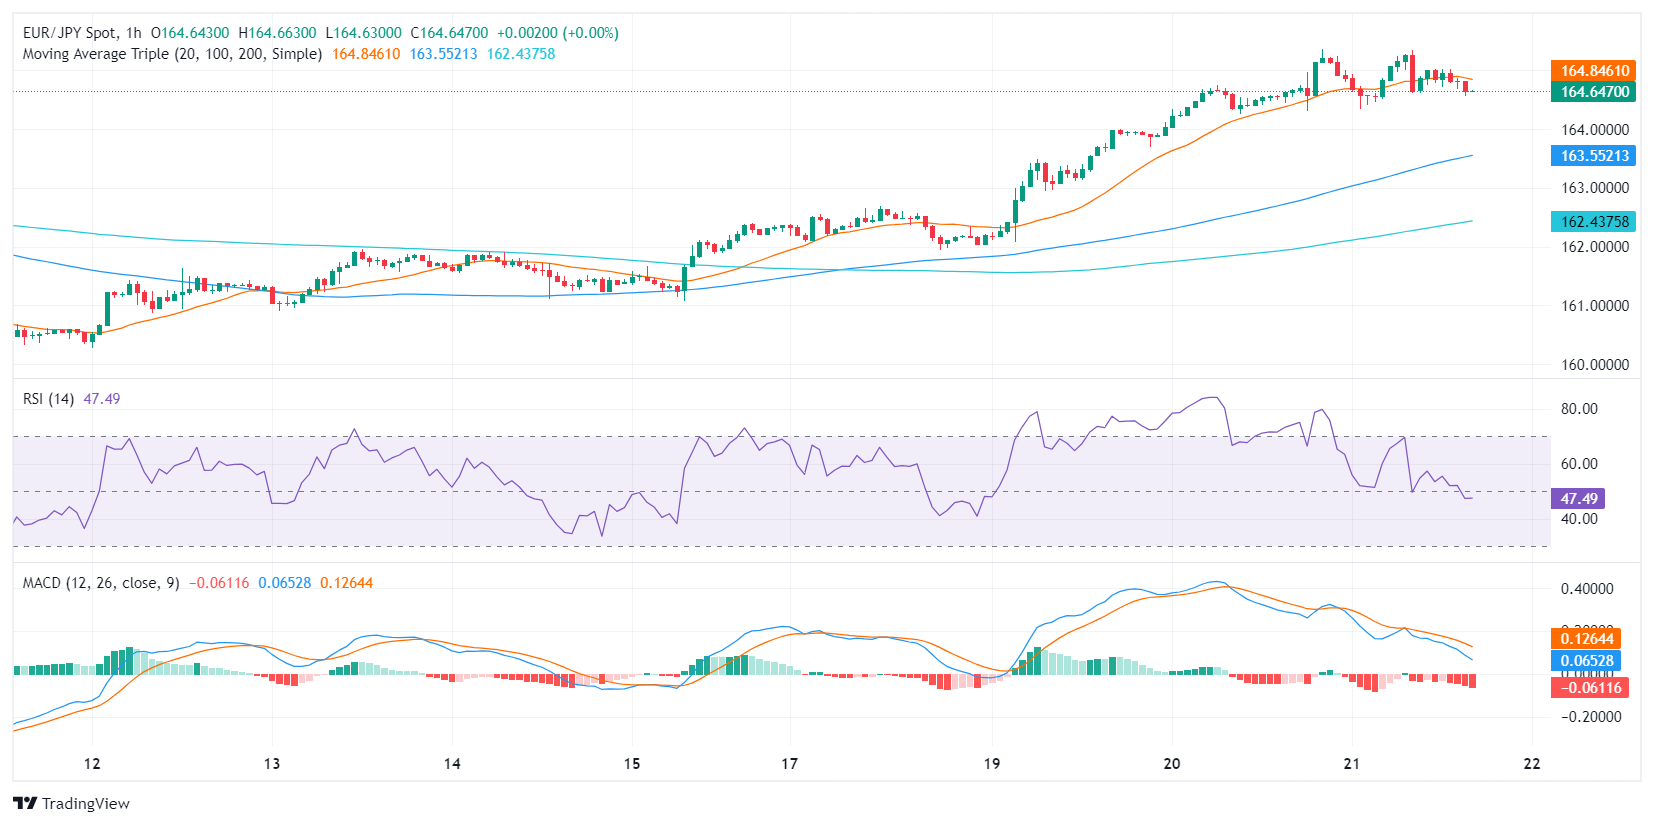
When examining the hourly chart, the RSI reveals some variability, with the latest reading at 47. This value is notably lower than the daily readings, suggesting that sellers might be gaining some ground in the short term. In addition, the MACD prints red bards which adds arguments to the growing selling pressure on the shorter timeframes.
EUR/JPY hourly chart
When analyzing with Simple Moving Averages (SMAs), the broader scale indicates that, despite a negative outlook in the short term, the pair maintains its position above the 20, 100, 200-day Simple Moving Averages, suggesting that, on a wider scope, the buyers are still firmly in control. However, if the technical correction extends below any of these levels the trend might slowly shift in favor of the seller.


© 2000-2026. All rights reserved.
This site is managed by Teletrade D.J. LLC 2351 LLC 2022 (Euro House, Richmond Hill Road, Kingstown, VC0100, St. Vincent and the Grenadines).
The information on this website is for informational purposes only and does not constitute any investment advice.
The company does not serve or provide services to customers who are residents of the US, Canada, Iran, The Democratic People's Republic of Korea, Yemen and FATF blacklisted countries.
Making transactions on financial markets with marginal financial instruments opens up wide possibilities and allows investors who are willing to take risks to earn high profits, carrying a potentially high risk of losses at the same time. Therefore you should responsibly approach the issue of choosing the appropriate investment strategy, taking the available resources into account, before starting trading.
Use of the information: full or partial use of materials from this website must always be referenced to TeleTrade as the source of information. Use of the materials on the Internet must be accompanied by a hyperlink to teletrade.org. Automatic import of materials and information from this website is prohibited.
Please contact our PR department if you have any questions or need assistance at pr@teletrade.global.
transfers