- Analytics
- News and Tools
- Market News
- NZD/JPY Price Analysis: Bulls dictate the market rhythm, hinting at temporary selling pressure
NZD/JPY Price Analysis: Bulls dictate the market rhythm, hinting at temporary selling pressure
- On the daily chart, indicators are consolidating but the outlook is favoring the bulls.
- The hourly chart gives hints of mounting selling traction with indicators deep in the red.
The NZD/JPY pair is currently trading at 91.60, slightly down in Thursday's session. Bulls hold a strong command over the market, even amidst transient selling pressure, which seems not to have weakened their movement with the pair holding above the 20,100 and 200-day Simple Moving Averages (SMAs).
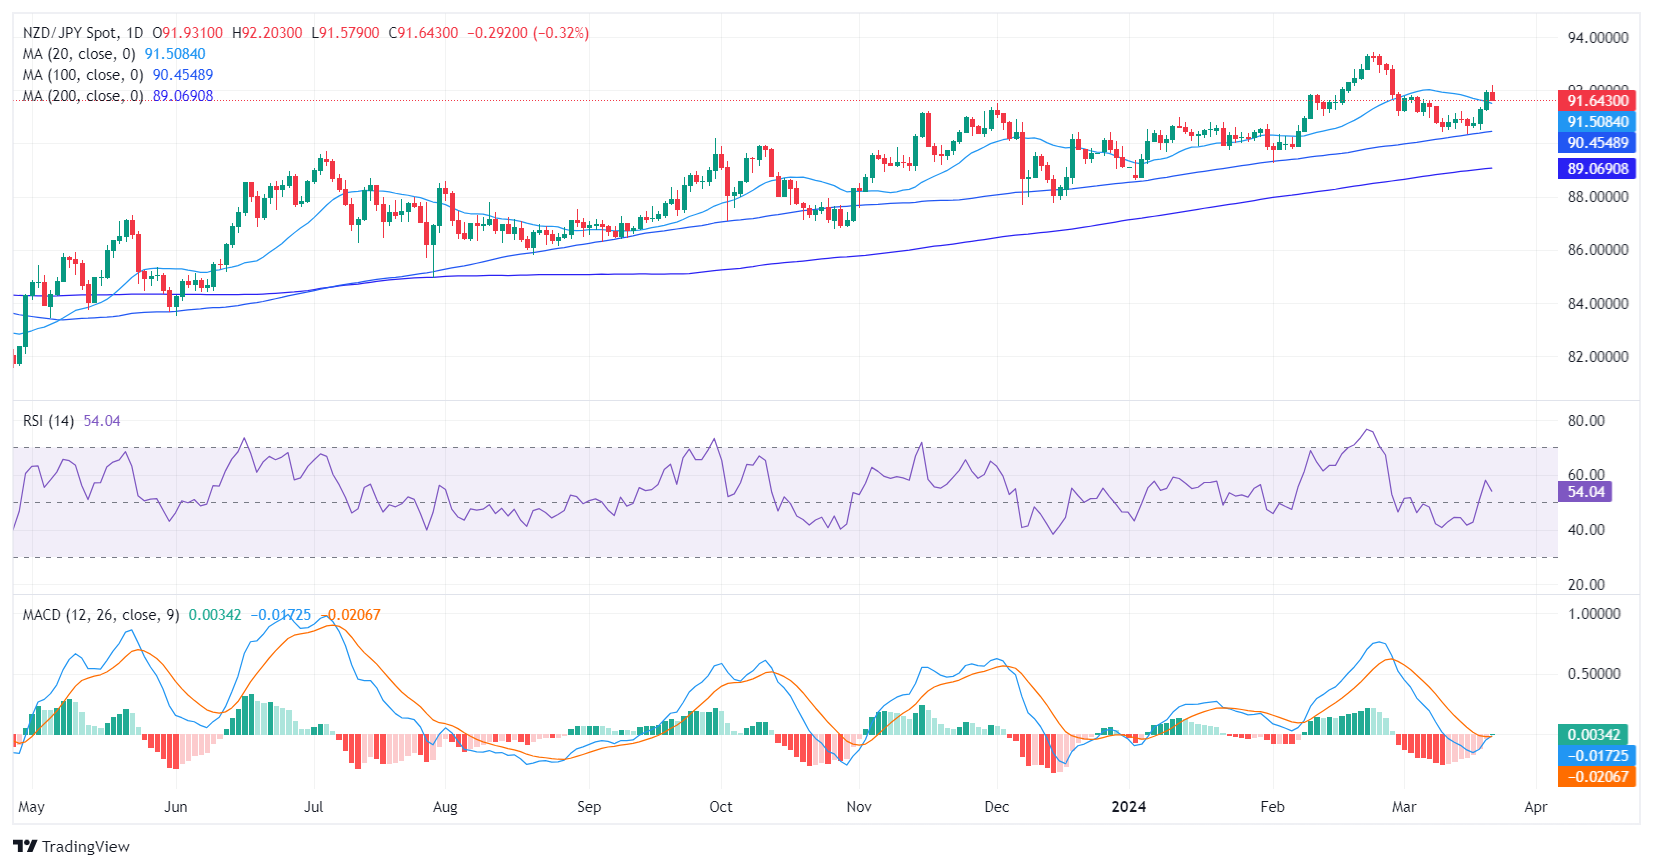
On the daily chart, the NZD/JPY pair reveals an influx of buyers dominating the market, as indicated by the Relative Strength Index (RSI) progressing towards positive territory. The latest reading at 55, sits in the positive zone, but points down, as indicators consolidate. Meanwhile, the Moving Average Convergence Divergence (MACD) reveals a declining trend with red bars, indicating steady but weakening negative momentum.
NZD/JPY daily chart
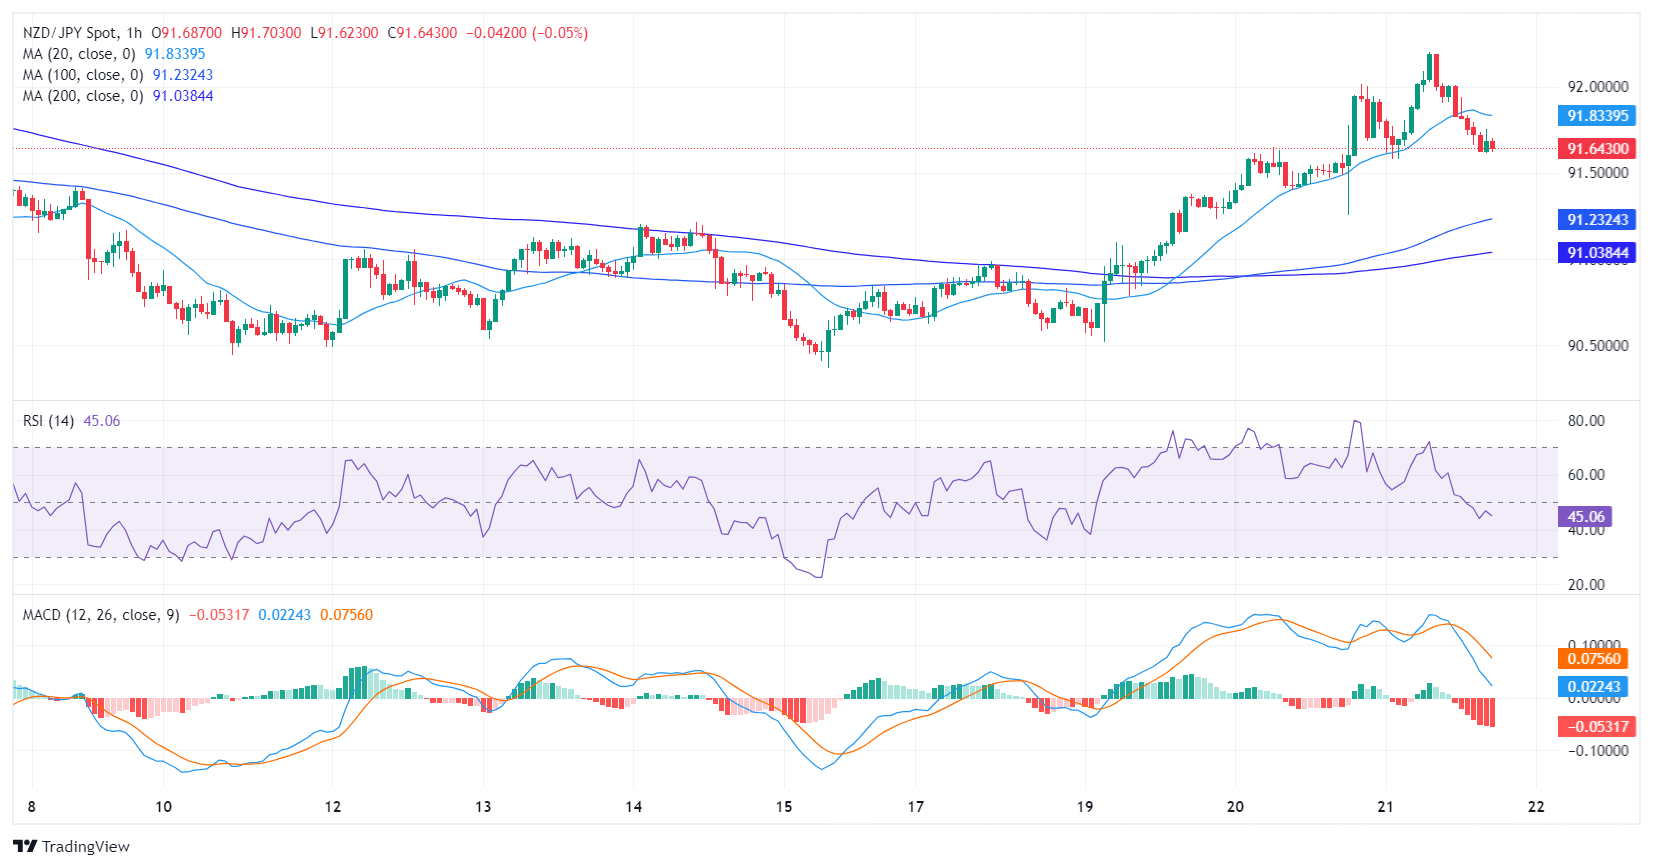
The hourly landscape provides a more detailed perspective. The RSI has been fluctuating around the negative territory in the recent hours, dropping to 45 by the last hour. It suggests an increase in selling pressure in the short term compared to the daily setup. The continuous red bars of the MACD affirm this, reflecting the negative momentum represented in the RSI. This implies that the sellers step in as the buyers seem to be taking profits.
NZD/JPY hourly chart
Overall, while bulls are in command of the broad trend, the pair could see some additional selling pressure, as selling momentum is present and buyers might continue taking profits from the last two days' gains.


© 2000-2026. All rights reserved.
This site is managed by Teletrade D.J. LLC 2351 LLC 2022 (Euro House, Richmond Hill Road, Kingstown, VC0100, St. Vincent and the Grenadines).
The information on this website is for informational purposes only and does not constitute any investment advice.
The company does not serve or provide services to customers who are residents of the US, Canada, Iran, The Democratic People's Republic of Korea, Yemen and FATF blacklisted countries.
Making transactions on financial markets with marginal financial instruments opens up wide possibilities and allows investors who are willing to take risks to earn high profits, carrying a potentially high risk of losses at the same time. Therefore you should responsibly approach the issue of choosing the appropriate investment strategy, taking the available resources into account, before starting trading.
Use of the information: full or partial use of materials from this website must always be referenced to TeleTrade as the source of information. Use of the materials on the Internet must be accompanied by a hyperlink to teletrade.org. Automatic import of materials and information from this website is prohibited.
Please contact our PR department if you have any questions or need assistance at pr@teletrade.global.
transfers