- Analytics
- News and Tools
- Market News
- Silver Price Analysis: XAG/USD tumbles as bearish engulfing pattern looms
Silver Price Analysis: XAG/USD tumbles as bearish engulfing pattern looms
- Silver prices see a significant drop to $24.75, shedding over 3% in response to a strengthening US Dollar.
- Technical analysis reveals a bearish engulfing pattern, despite a recent 'golden cross', signaling mixed signals for traders.
- The RSI indicates diminishing buying pressure, hinting at a potential bearish swing.
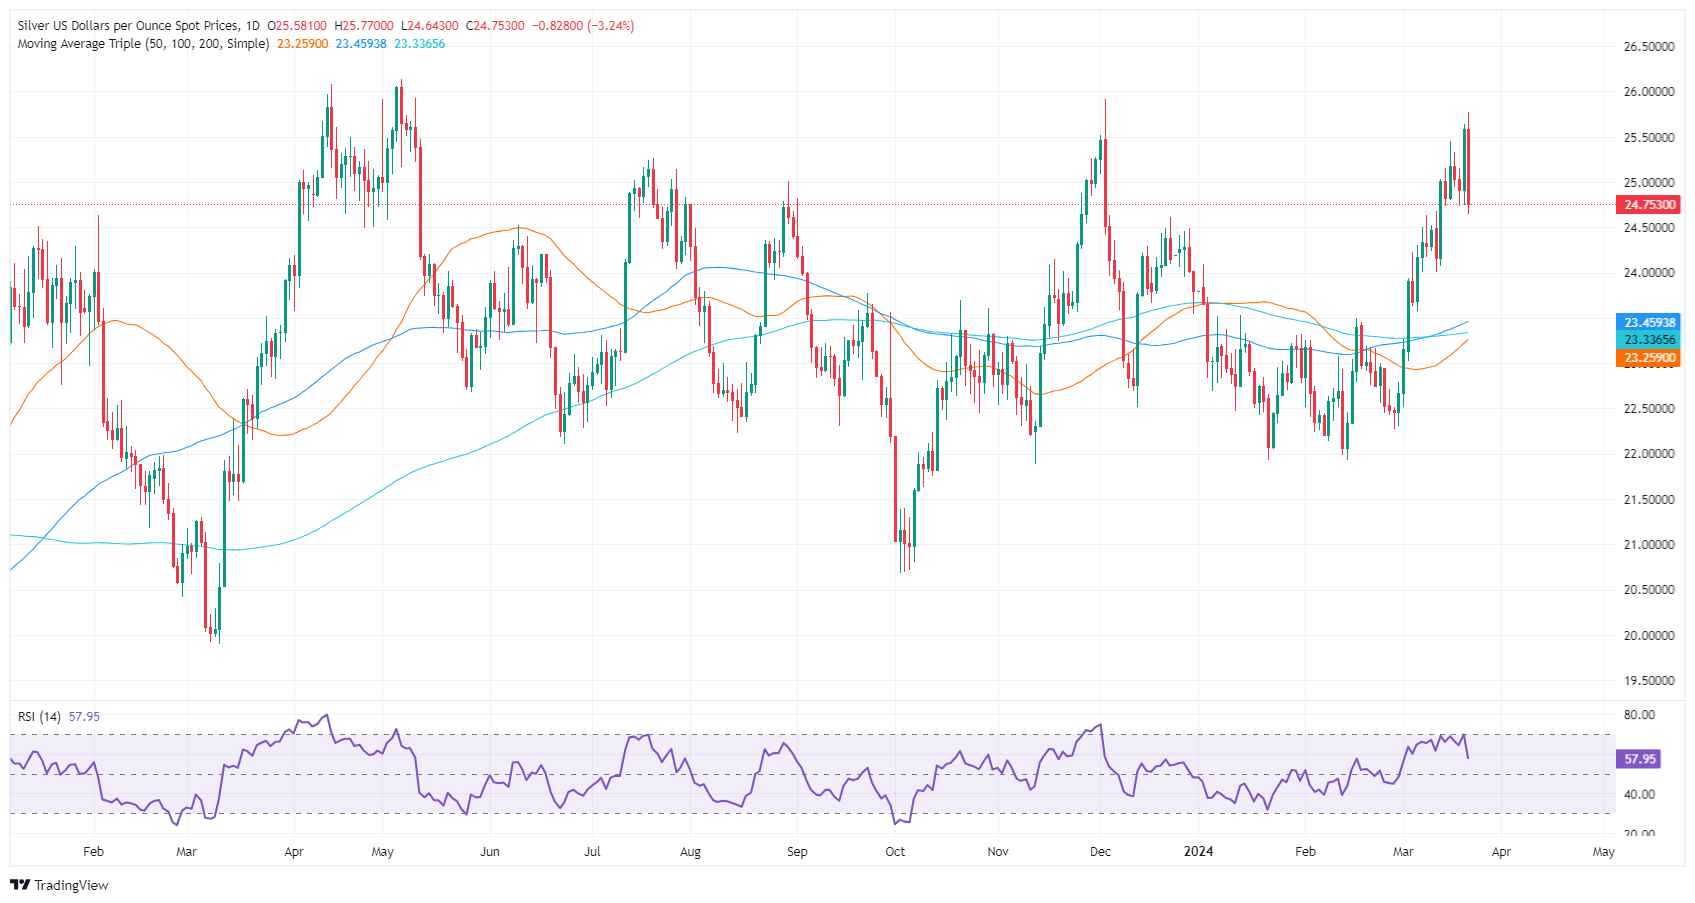
Silver's price plunged on Thursday amidst a risk-off impulse, reinvigorating the US Dollar. Consequently, the grey metal dropped more than $0.70, or 3.15%, as the XAG/USD traded at $24.75 after hitting a daily high of $25.77.
XAG/USD Price Analysis: Technical outlook
Silver is witnessing a downturn, as price action has formed a ‘bearish engulfing’ chart pattern in the last couple of days. Even though the 50-day moving average (DMA) has crossed above the 200-DMA, forming a classic ‘golden cross’ indicating that bulls are gathering steam, momentum suggests the opposite.
The Relative Strength Index (RSI) is hovering just below 60 after peaking around 70, indicating that moderate buying pressure remains. However, the RSI's descent from higher levels suggests that momentum might wane, and bears could gain ground.
The recent pullback has seen the price retreat from resistance near the $26.00 mark. Immediate support is found near December’s 22 high turned support at $24.60, followed by the $24.00 level. A breach of the latter could open a path towards the $23.00 area, marked by the previous cycle lows.
On the other hand, an XAG/USD daily close above $25.00 could pave the way for challenging yearly highs at $25.77, followed by last year’s high at $25.91.
XAG/USD Price Action – Daily Chart


© 2000-2026. All rights reserved.
This site is managed by Teletrade D.J. LLC 2351 LLC 2022 (Euro House, Richmond Hill Road, Kingstown, VC0100, St. Vincent and the Grenadines).
The information on this website is for informational purposes only and does not constitute any investment advice.
The company does not serve or provide services to customers who are residents of the US, Canada, Iran, The Democratic People's Republic of Korea, Yemen and FATF blacklisted countries.
Making transactions on financial markets with marginal financial instruments opens up wide possibilities and allows investors who are willing to take risks to earn high profits, carrying a potentially high risk of losses at the same time. Therefore you should responsibly approach the issue of choosing the appropriate investment strategy, taking the available resources into account, before starting trading.
Use of the information: full or partial use of materials from this website must always be referenced to TeleTrade as the source of information. Use of the materials on the Internet must be accompanied by a hyperlink to teletrade.org. Automatic import of materials and information from this website is prohibited.
Please contact our PR department if you have any questions or need assistance at pr@teletrade.global.
transfers