- Analytics
- News and Tools
- Market News
- NZD/USD Price Analysis: Bearish momentum gains ground, yet sellers may start to back off
NZD/USD Price Analysis: Bearish momentum gains ground, yet sellers may start to back off
- The NZD/USD pair maintains its losing streak, depicting a bearish session on Thursday.
- The RSI for the daily chart points to a growing selling momentum, while MACD prints rising red bars.
- Mimicking the daily chart, the hourly signals flash the ongoing strength of the sellers but with indicators somewhat flat.
The NZD/USD pair is trading lower at around 0.6045, undergoing a 0.33% decline. The currency pair's market sentiment seems to lean towards the bearish side, with sellers maintaining a strong grip. On the hourly chart, the selling pressure eased somewhat but the bears are still present.
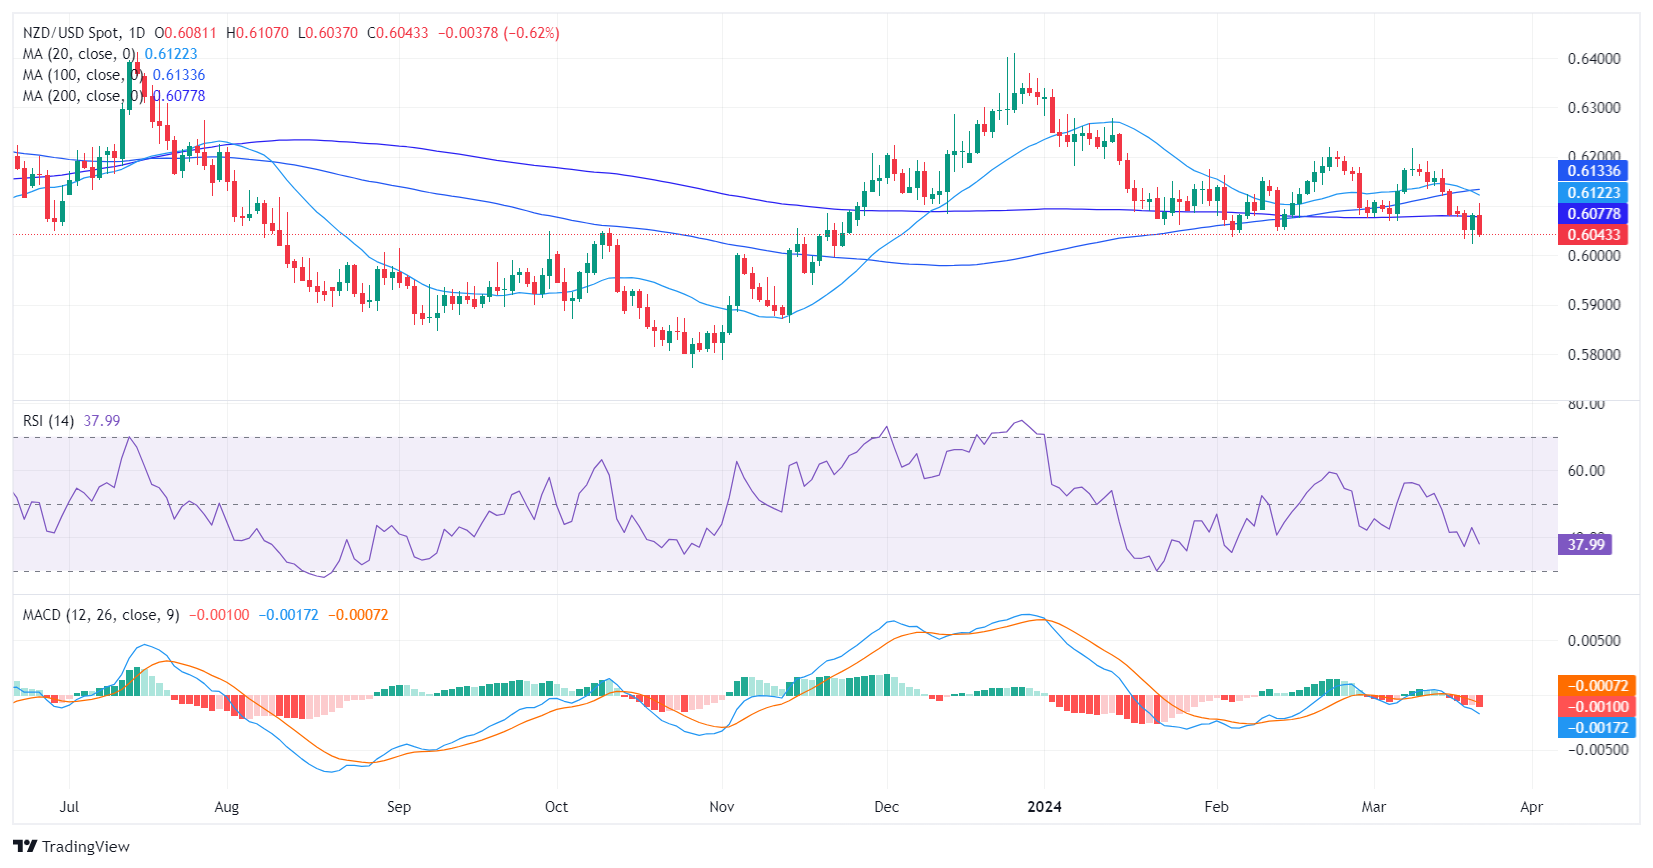
On the daily chart, the Relative Strength Index (RSI) remains in negative territory, suggesting that sellers dominate the market. Furthermore, the rising red bars of the Moving Average Convergence Divergence (MACD) histogram indicate growing negative momentum, further supporting this bearish outlook.
NZD/USD daily chart
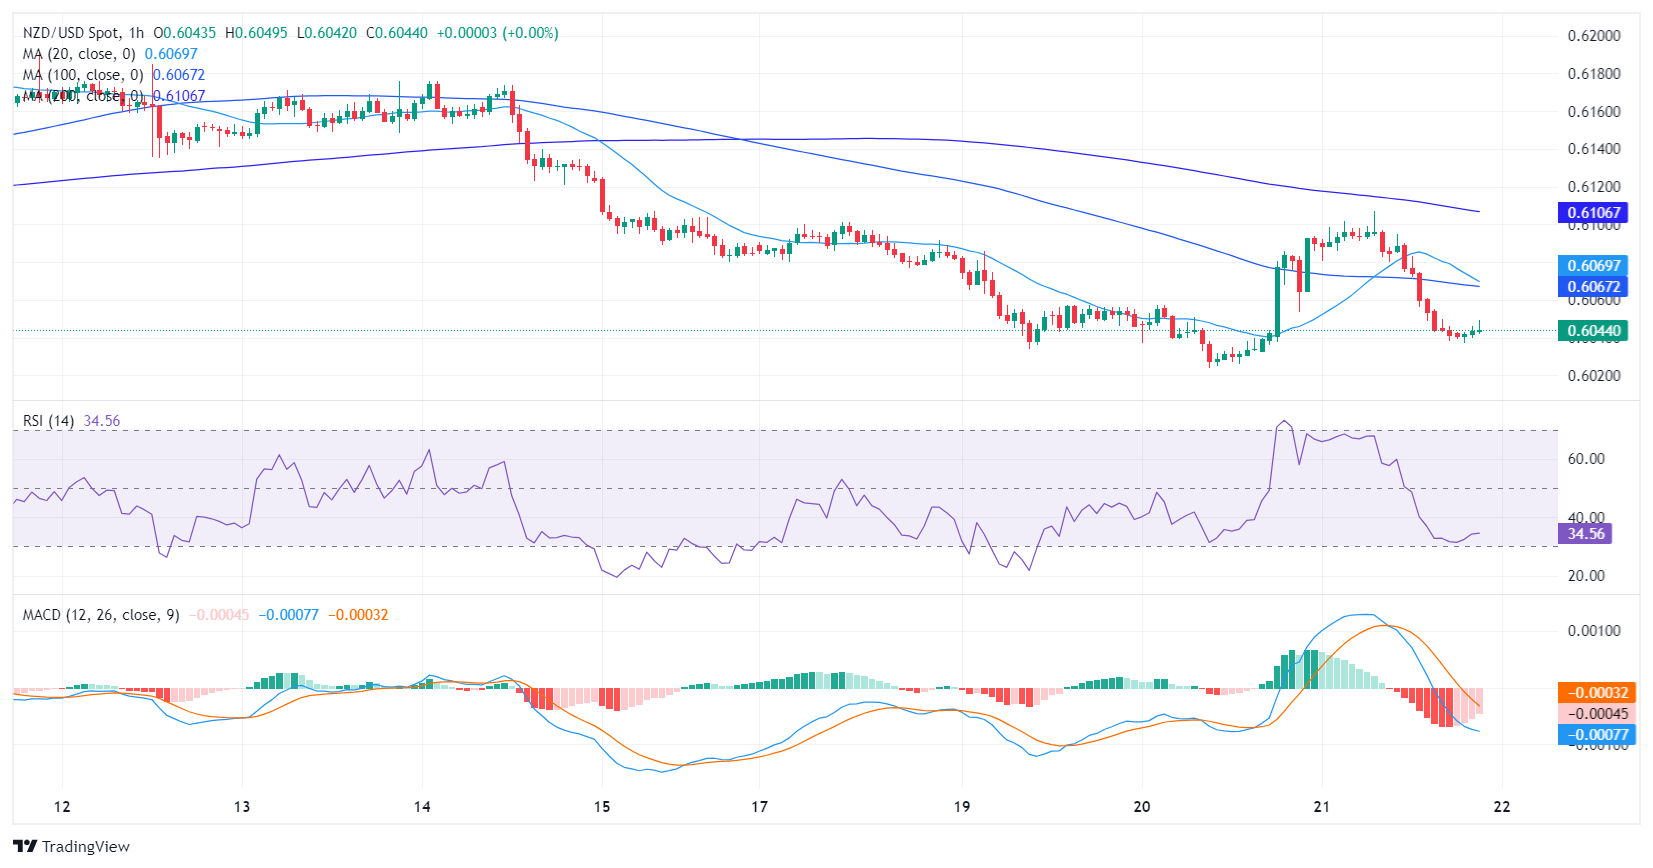
When reviewing the hourly chart, a similar pattern arises. The RSI still resides in the negative territory, indicating a bearish momentum prevailing in the market. The red bars of the MACD histogram continue to increase in this shorter timeframe, signaling the ongoing strength of the sellers. However, the latter flattened near the oversold indicating that the pair may consolidate the downwards movements ahead of the Asian session. Fundamental factors will be key as they could prompt another leg downwards.
NZD/USD hourly chart
A consistent negative trend is evident across both timeframes after comparing the daily and hourly charts. The RSI and MACD indicators suggest continuing domination by sellers in the NZD/USD pair. Surveying the larger context, the pair falls below the 20, 100, and 200-day Simple Moving Averages (SMAs), adding more evidence to the negative trend depicted in the daily and hourly charts.


© 2000-2026. All rights reserved.
This site is managed by Teletrade D.J. LLC 2351 LLC 2022 (Euro House, Richmond Hill Road, Kingstown, VC0100, St. Vincent and the Grenadines).
The information on this website is for informational purposes only and does not constitute any investment advice.
The company does not serve or provide services to customers who are residents of the US, Canada, Iran, The Democratic People's Republic of Korea, Yemen and FATF blacklisted countries.
Making transactions on financial markets with marginal financial instruments opens up wide possibilities and allows investors who are willing to take risks to earn high profits, carrying a potentially high risk of losses at the same time. Therefore you should responsibly approach the issue of choosing the appropriate investment strategy, taking the available resources into account, before starting trading.
Use of the information: full or partial use of materials from this website must always be referenced to TeleTrade as the source of information. Use of the materials on the Internet must be accompanied by a hyperlink to teletrade.org. Automatic import of materials and information from this website is prohibited.
Please contact our PR department if you have any questions or need assistance at pr@teletrade.global.
transfers