- Analytics
- News and Tools
- Market News
- AUD/JPY Price Analysis: Bearish pressure intensifies, sellers eye the 20-day SMA
AUD/JPY Price Analysis: Bearish pressure intensifies, sellers eye the 20-day SMA
- The daily chart reveals an overall positive trend but indicators took a big hit on Friday.
- The hourly RSI hints at a possible short-term upswing following a plunge into the oversold territory.
- The pair might side-ways trade to consolidate Friday’s movements..
The AUD/JPY pair is currently trading at 98.60, showing a substantial decrease of nearly 1%. Despite this decline, the broader trend continues to show positivity, with bulls maintaining their control. In addition, as the downward movements might be over-extended, the pair may enter a consolidation phase.
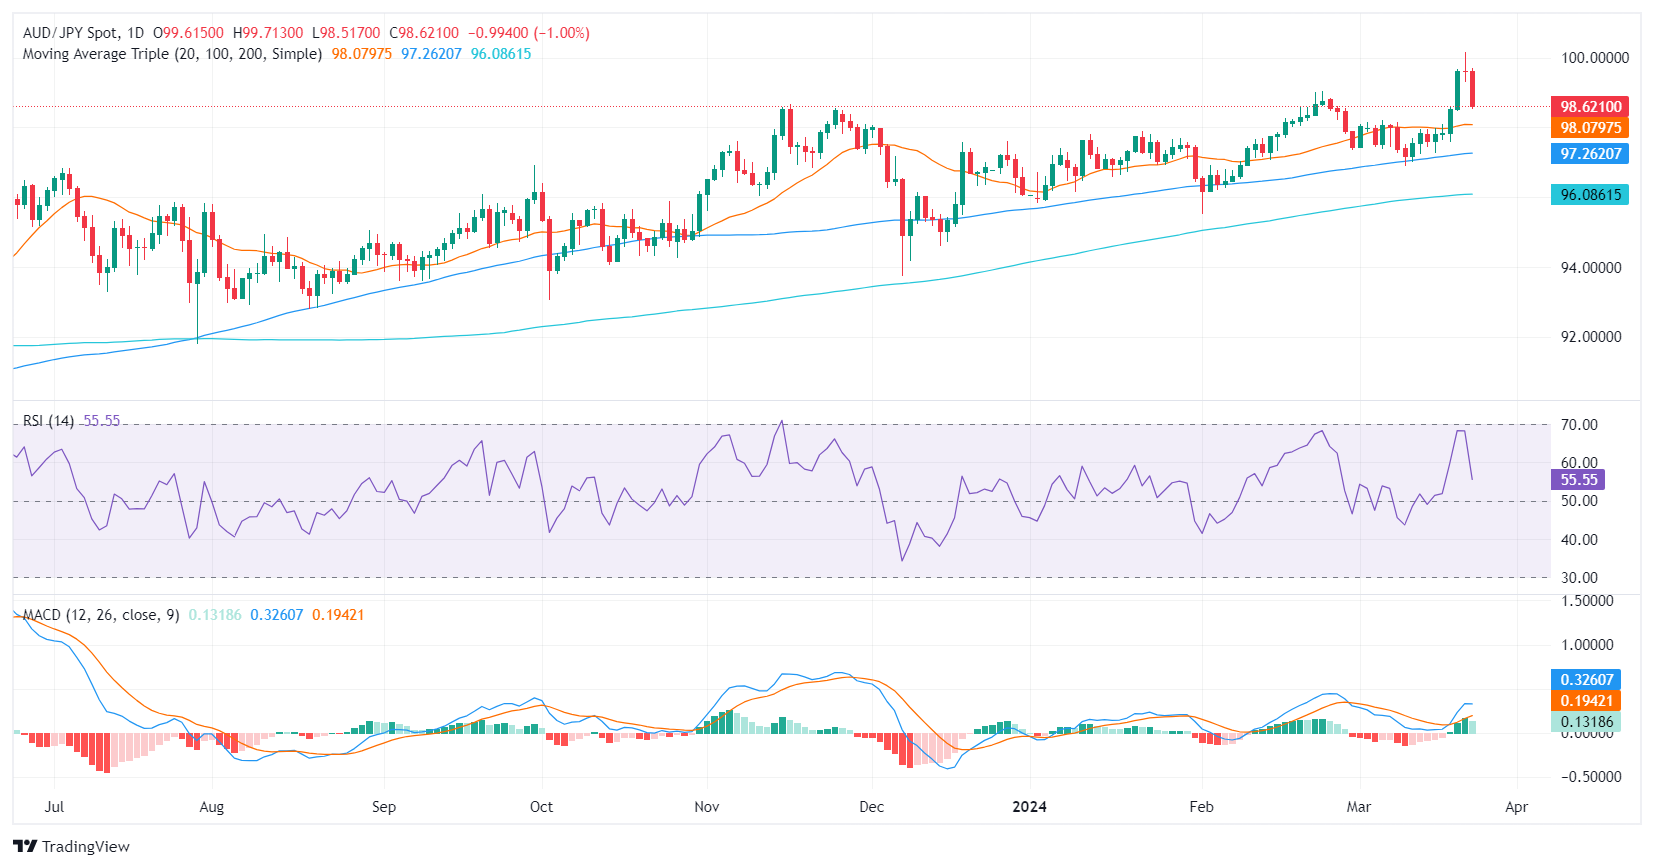
On the daily chart, the technical outlook for the AUD/JPY pair suggests a positive trend. The latest Relative Strength Index (RSI) reading resides in the positive territory, aligning with the recent upward momentum. Having peaked near overbought conditions earlier in the week, the RSI has now pulled back to a moderate level, pointing towards potential consolidation. Concurrently, the Moving Average Convergence Divergence (MACD) paints a contrasting picture, showing decreasing green bars that signify a slowdown in positive market momentum.
AUD/JPY daily chart
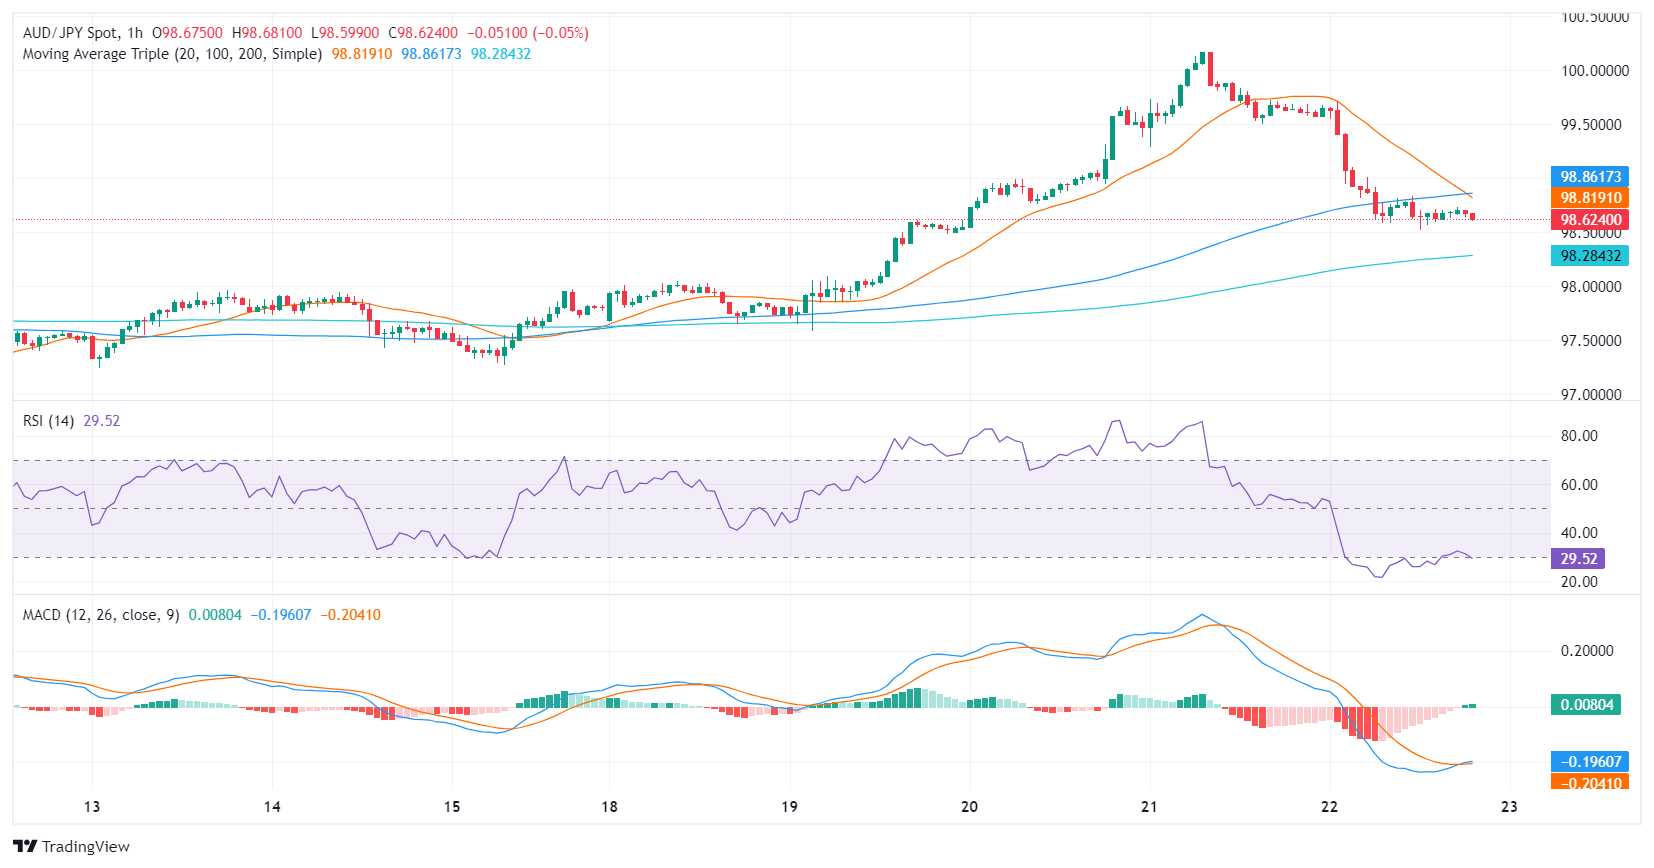
Switching to the hourly chart, the last session's RSI plunged deep into the oversold territory, which could hint at a potential short-term correction upwards. Despite the sharp drop in the RSI, the MACD histogram displays flat green bars, implying stagnating bullish momentum on hourly timeframes.
AUD/JPY hourly chart
The next target for the sellers is the 20-day Simple Moving Average (SMA) at 98.10. Below that the 100 and 200-day SMAs will act as strong supports in case the downside pressure persists but if the bulls defend this level, the overall trend will remain positive.


© 2000-2026. All rights reserved.
This site is managed by Teletrade D.J. LLC 2351 LLC 2022 (Euro House, Richmond Hill Road, Kingstown, VC0100, St. Vincent and the Grenadines).
The information on this website is for informational purposes only and does not constitute any investment advice.
The company does not serve or provide services to customers who are residents of the US, Canada, Iran, The Democratic People's Republic of Korea, Yemen and FATF blacklisted countries.
Making transactions on financial markets with marginal financial instruments opens up wide possibilities and allows investors who are willing to take risks to earn high profits, carrying a potentially high risk of losses at the same time. Therefore you should responsibly approach the issue of choosing the appropriate investment strategy, taking the available resources into account, before starting trading.
Use of the information: full or partial use of materials from this website must always be referenced to TeleTrade as the source of information. Use of the materials on the Internet must be accompanied by a hyperlink to teletrade.org. Automatic import of materials and information from this website is prohibited.
Please contact our PR department if you have any questions or need assistance at pr@teletrade.global.
transfers