- Analytics
- News and Tools
- Market News
- NZD/USD Price Analysis: Bears maintain control, signs of short-term recovery surface
NZD/USD Price Analysis: Bears maintain control, signs of short-term recovery surface
- Indicators flash oversold conditions on the daily chart.
- Contrarily, hourly chart indicators suggest a slow return of bullish impulse as the bears might have run out of steam.
In Friday's session, the NZD/USD declined just below the 0.6000 threshold, illustrating a bearish outlook as sellers continue to dominate the market. The pair is positioned below its primary Simple Moving Averages (SMAs), further backing the bearish perspective. Technical indicators hint at a strengthening sellers' command but indicators lay in oversold terrain, a typical signal, and the buying momentum might recover.
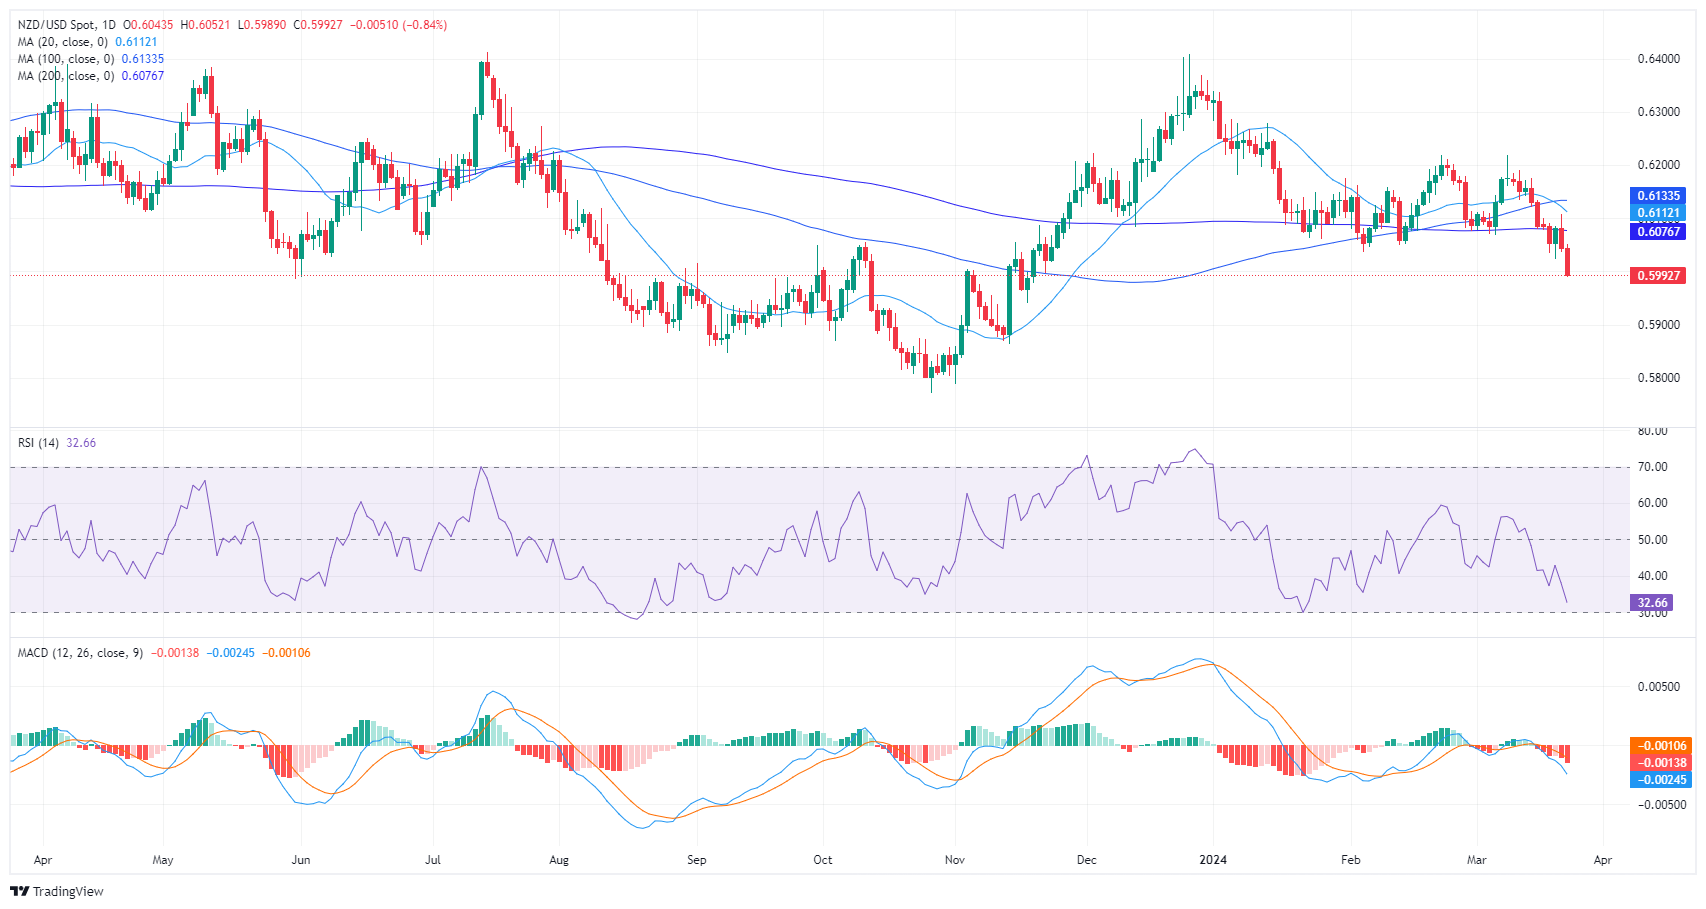
On the daily chart, the Relative Strength Index (RSI) for the NZD/USD pair resides in negative territory presently, indicating a prevailing downtrend as sellers dominate the market. The RSI was reported at 33, bordering on oversold conditions, a potential indication for future corrective movement. The Moving Average Convergence Divergence (MACD) histogram exhibits rising red bars, also confirming the negative momentum.
NZD/USD daily chart
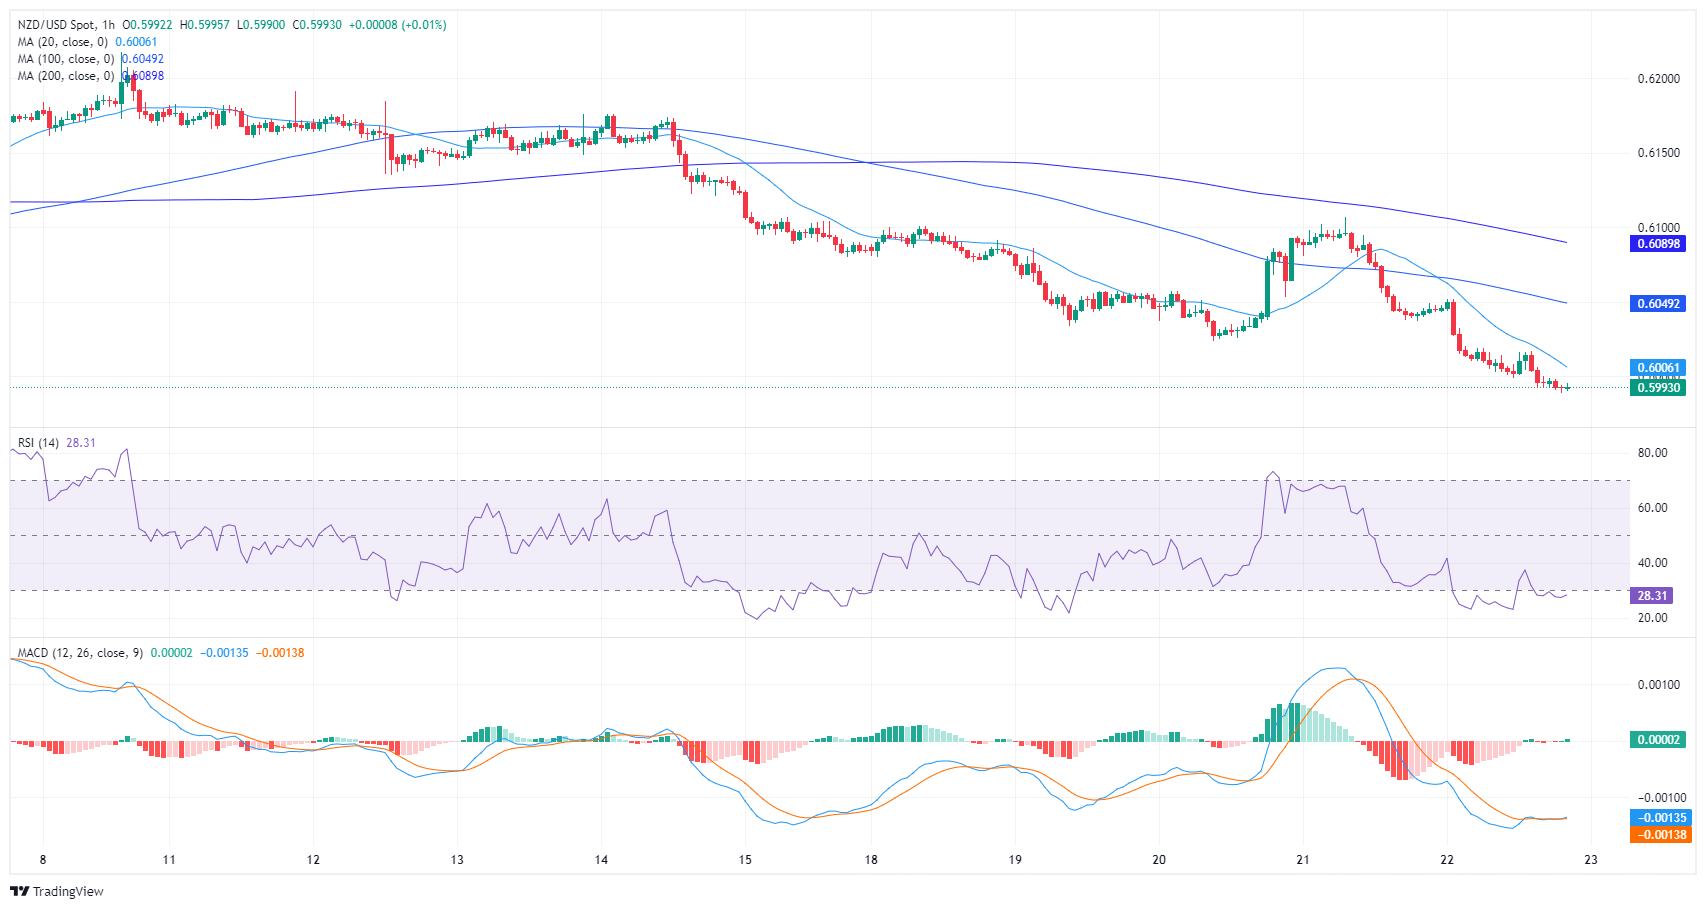
Moving to the hourly chart, the RSI levels convey a relatively similar scenario. The value last rested at 28, corroborating its presence in the oversold territory. Contrarily, the MACD on the hourly chart displays rising green bars, hinting at a creeping positive momentum.
NZD/USD hourly chart
In essence, while the daily chart discloses a persisting bearish momentum, hourly indications of rising positive momentum in the MACD histogram may signal a reprieve from selling pressure. Looking at the broader trend, the pair is below the 20, 100, and 200-day Simple Moving Averages (SMAs), further implying a bearish outlook.


© 2000-2026. All rights reserved.
This site is managed by Teletrade D.J. LLC 2351 LLC 2022 (Euro House, Richmond Hill Road, Kingstown, VC0100, St. Vincent and the Grenadines).
The information on this website is for informational purposes only and does not constitute any investment advice.
The company does not serve or provide services to customers who are residents of the US, Canada, Iran, The Democratic People's Republic of Korea, Yemen and FATF blacklisted countries.
Making transactions on financial markets with marginal financial instruments opens up wide possibilities and allows investors who are willing to take risks to earn high profits, carrying a potentially high risk of losses at the same time. Therefore you should responsibly approach the issue of choosing the appropriate investment strategy, taking the available resources into account, before starting trading.
Use of the information: full or partial use of materials from this website must always be referenced to TeleTrade as the source of information. Use of the materials on the Internet must be accompanied by a hyperlink to teletrade.org. Automatic import of materials and information from this website is prohibited.
Please contact our PR department if you have any questions or need assistance at pr@teletrade.global.
transfers