- Analytics
- News and Tools
- Market News
- AUD/JPY Price Analysis: Bears show momentary dominance, long-term bullish tilt remains
AUD/JPY Price Analysis: Bears show momentary dominance, long-term bullish tilt remains
- The daily chart shows a mild bullish momentum as indicated by the RSI, whereas the MACD signals a balanced market environment.
- On the hourly chart, growing selling pressure is evident.
In Tuesday's session, AUD/JPY was seen declining to 98.95, marking mild losses. Despite the insignificant setback, neither buyers nor sellers have gained a distinct advantage, indicating potential market stability or a possible shift in direction. While signs of selling pressure are evident, the pair exhibits a strong stand over the 20,100 and 200-day Simple Moving Averages (SMAs), signifying long-term bullish sentiment. That being said, there are signals that the sellers are present after pushing the pair down by nearly 1% last Friday.
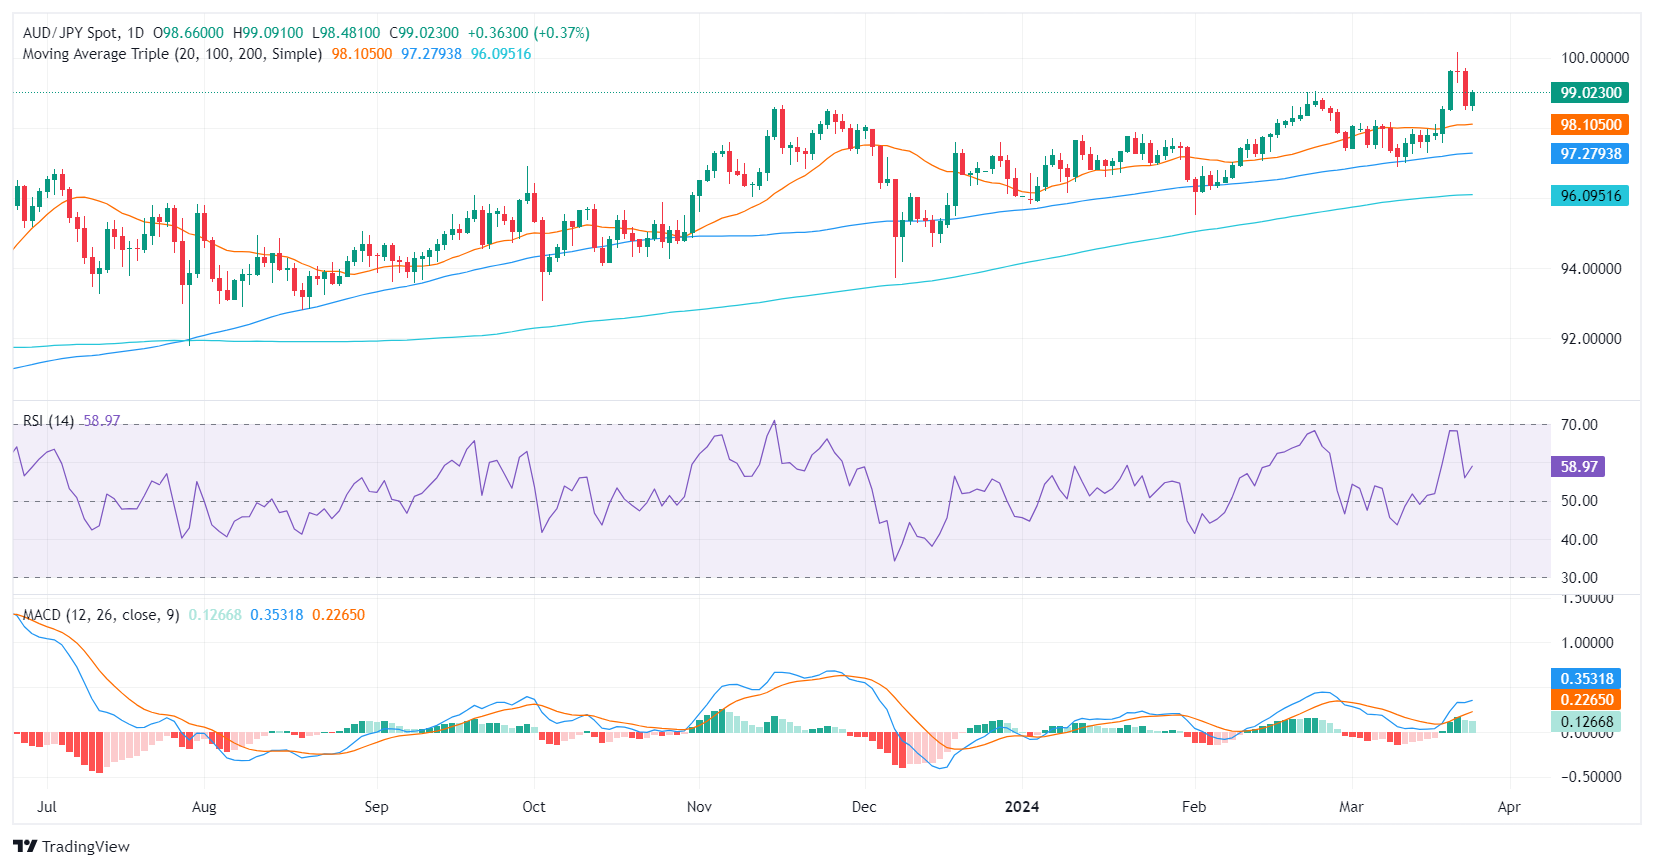
On the daily chart, the Relative Strength Index (RSI) stands with a neutral slope. The flattening trend and the green bars of the Moving Average Convergence Divergence (MACD) hint that the market remains largely balanced, with neither buyers nor sellers having a distinct edge on Tuesday.
AUD/JPY daily chart
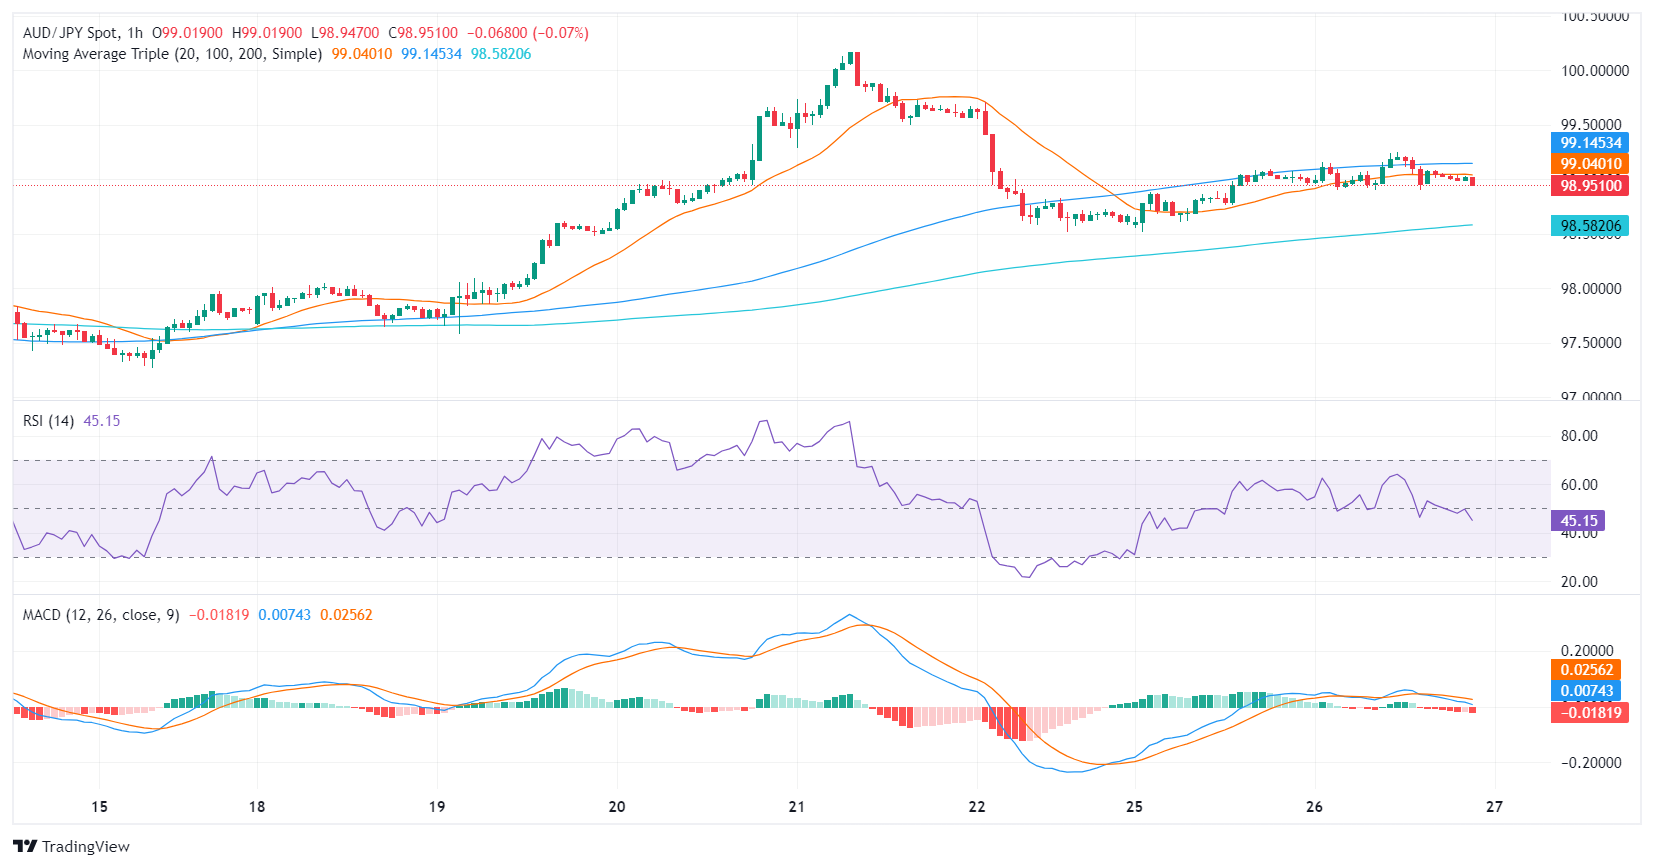
Moving onto the hourly chart, the RSI trajectory appears slightly bearish, with recent readings below 50, suggesting mounting selling pressure. The rising red MACD histogram bars further confirm the existing negative momentum.
AUD/JPY hourly chart
When assessing both charts, the short-term outlook seems to contrast with the daily chart's indications, which appear less bearish. It is evident that the bears are taking a breather following last week’s strong downward movements, but are still around the corner. However, the 1% dip seen on Friday, hasn’t affected yet the overall bullish trend.


© 2000-2026. All rights reserved.
This site is managed by Teletrade D.J. LLC 2351 LLC 2022 (Euro House, Richmond Hill Road, Kingstown, VC0100, St. Vincent and the Grenadines).
The information on this website is for informational purposes only and does not constitute any investment advice.
The company does not serve or provide services to customers who are residents of the US, Canada, Iran, The Democratic People's Republic of Korea, Yemen and FATF blacklisted countries.
Making transactions on financial markets with marginal financial instruments opens up wide possibilities and allows investors who are willing to take risks to earn high profits, carrying a potentially high risk of losses at the same time. Therefore you should responsibly approach the issue of choosing the appropriate investment strategy, taking the available resources into account, before starting trading.
Use of the information: full or partial use of materials from this website must always be referenced to TeleTrade as the source of information. Use of the materials on the Internet must be accompanied by a hyperlink to teletrade.org. Automatic import of materials and information from this website is prohibited.
Please contact our PR department if you have any questions or need assistance at pr@teletrade.global.
transfers