- Analytics
- News and Tools
- Market News
- Silver Price Analysis: XAG/USD languishes near two-week low, seems vulnerable to slide further
Silver Price Analysis: XAG/USD languishes near two-week low, seems vulnerable to slide further
- Silver drops to a two-week low on Wednesday, albeit manages to hold above the 38.2% Fibo.
- The mixed technical setup warrants some caution before positioning for any further downfall.
- Any attempted recovery might confront a stiff barrier and remain capped near the $25.00 mark.
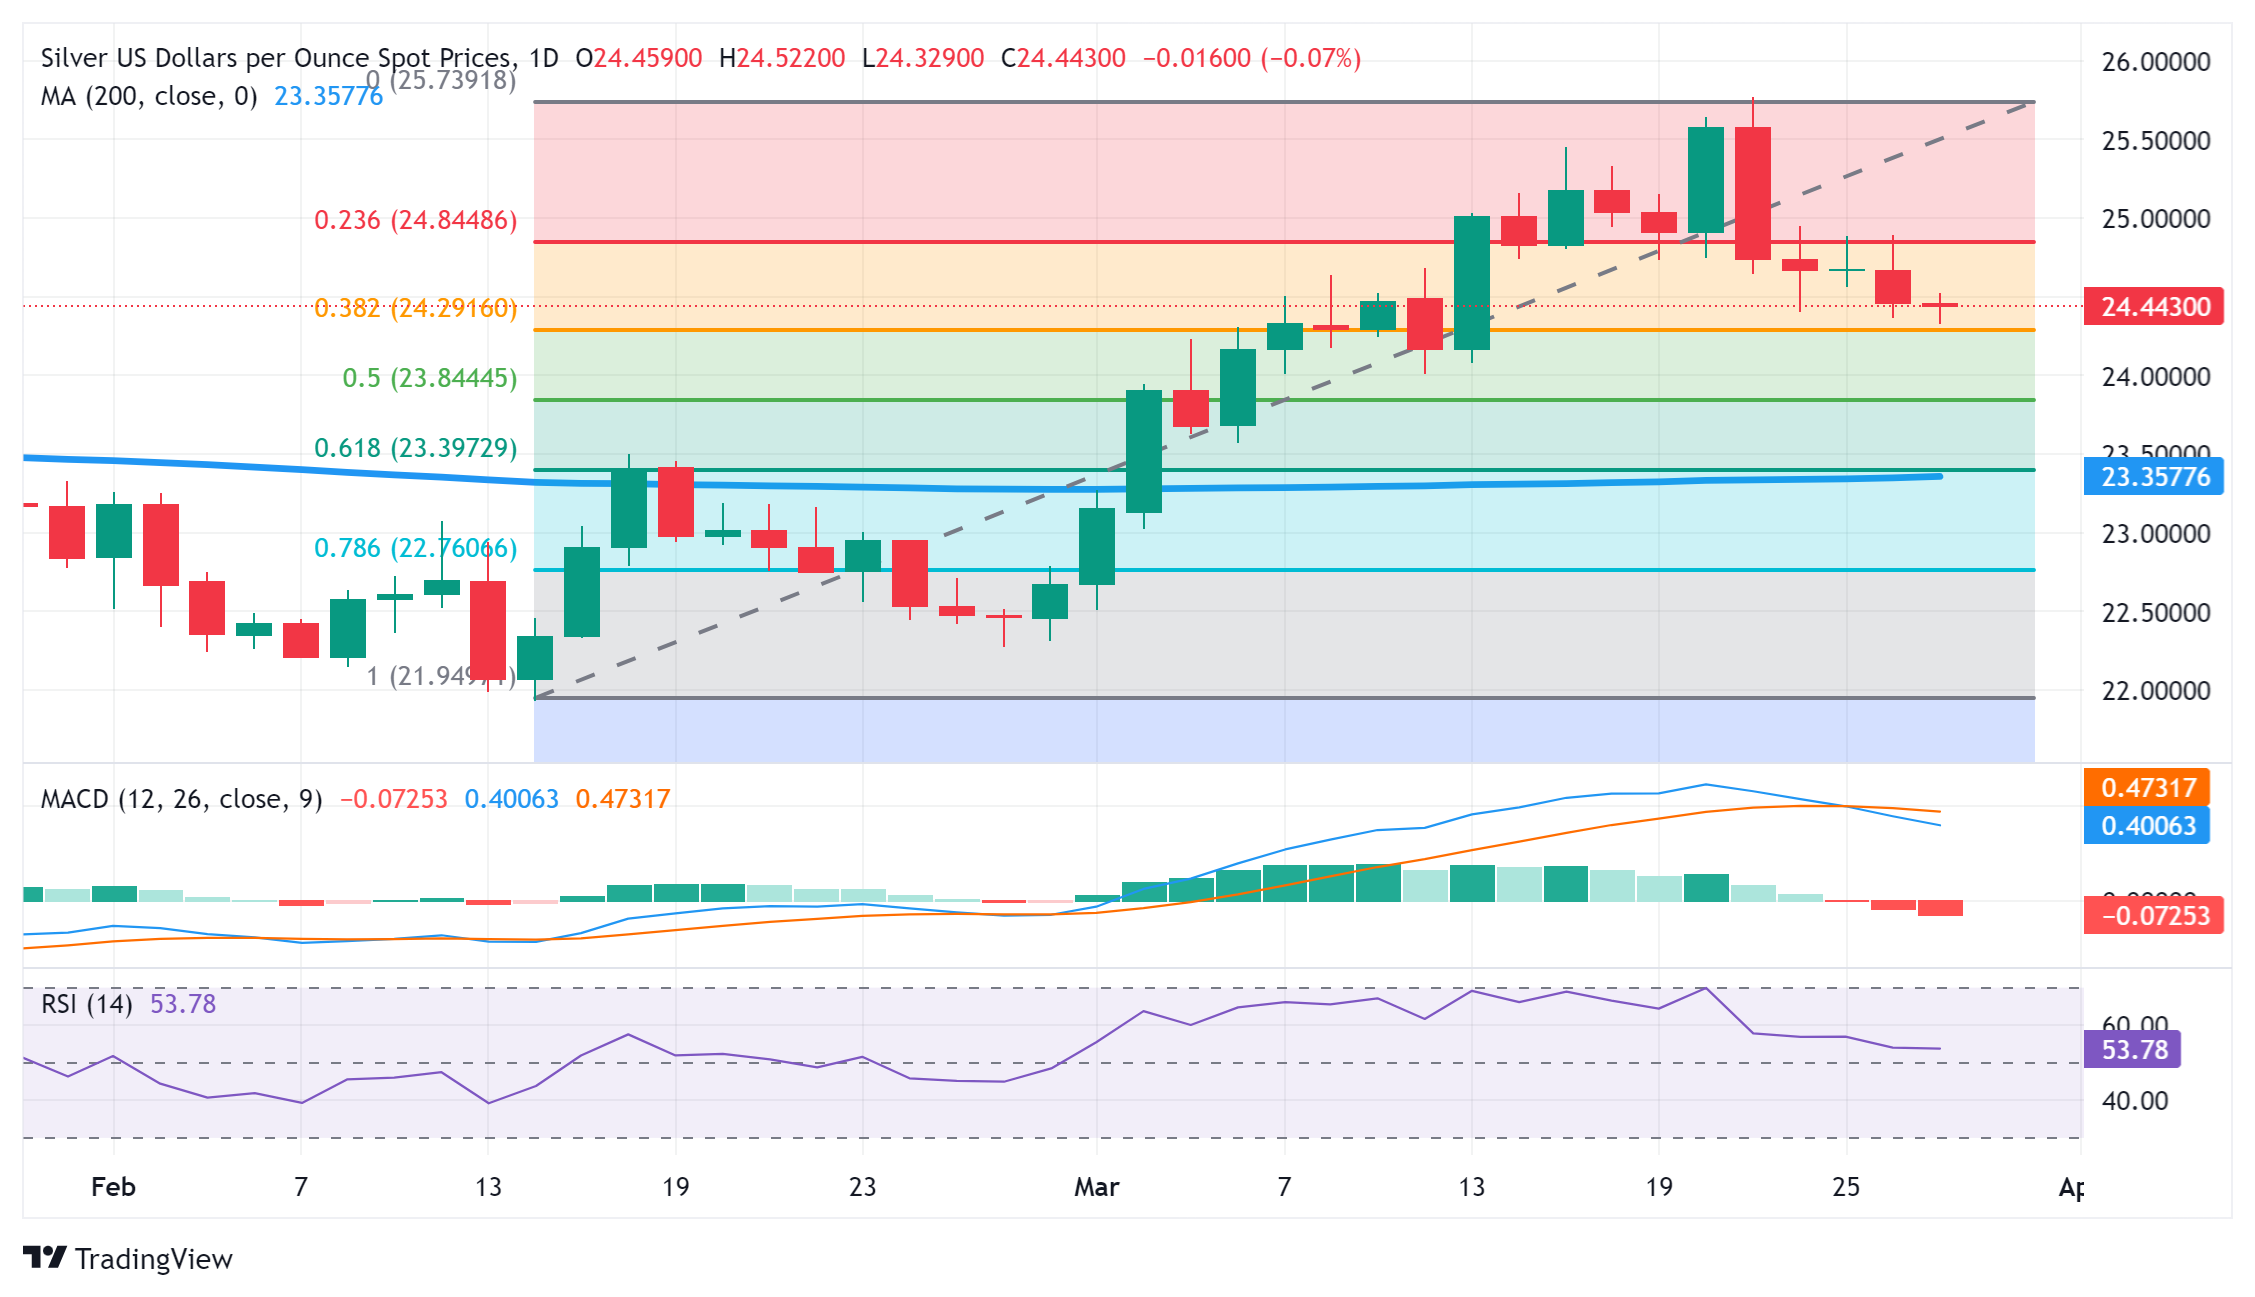
Silver (XAG/USD) oscillates in a narrow trading band through the first half of the European session and consolidates its recent losses to a two-week low touched earlier this Wednesday. The white metal currently trades just below the mid-$24.00s and seems vulnerable to prolonging its recent pullback from the YTD peak touched last week.
That said, mixed technical indicators on the daily chart and failure to break through the 38.2% Fibonacci retracement level of the February-March rally, warrant some caution for aggressive bearish traders. Hence, it will be prudent to wait for some follow-through selling below the $24.30 support zone before positioning for a further depreciating move. The XAG/USD might then weaken further below the $24.00 round-figure mark and test the 50% Fibo. level near the $23.85 zone.
The subsequent downfall has the potential to drag the white metal to the $23.40 confluence, comprising the 61.8% Fibo. and the very important 200-day Simple Moving Average (SMA), en route to the $23.00 round-figure mark. Failure to defend the latter might expose the next relevant support near the $22.45 region.
On the flip side, any attempted recovery is likely to attract fresh sellers and remain capped near the $25.00 psychological mark. That said, a sustained strength beyond the said handle might trigger a bout of a short-covering rally and lift the XAG/USD to the $25.50 region en route to the YTD peak, around the $25.75-$25.80 region. This is followed by the December 2023 swing high, just ahead of the $26.00 round figure, which if cleared will set the stage for additional near-term gains.
Silver daily chart


© 2000-2026. All rights reserved.
This site is managed by Teletrade D.J. LLC 2351 LLC 2022 (Euro House, Richmond Hill Road, Kingstown, VC0100, St. Vincent and the Grenadines).
The information on this website is for informational purposes only and does not constitute any investment advice.
The company does not serve or provide services to customers who are residents of the US, Canada, Iran, The Democratic People's Republic of Korea, Yemen and FATF blacklisted countries.
Making transactions on financial markets with marginal financial instruments opens up wide possibilities and allows investors who are willing to take risks to earn high profits, carrying a potentially high risk of losses at the same time. Therefore you should responsibly approach the issue of choosing the appropriate investment strategy, taking the available resources into account, before starting trading.
Use of the information: full or partial use of materials from this website must always be referenced to TeleTrade as the source of information. Use of the materials on the Internet must be accompanied by a hyperlink to teletrade.org. Automatic import of materials and information from this website is prohibited.
Please contact our PR department if you have any questions or need assistance at pr@teletrade.global.
transfers