- Analytics
- News and Tools
- Market News
- NZD/JPY Price Analysis: Bearish forces at play, bulls continue strugguling
NZD/JPY Price Analysis: Bearish forces at play, bulls continue strugguling
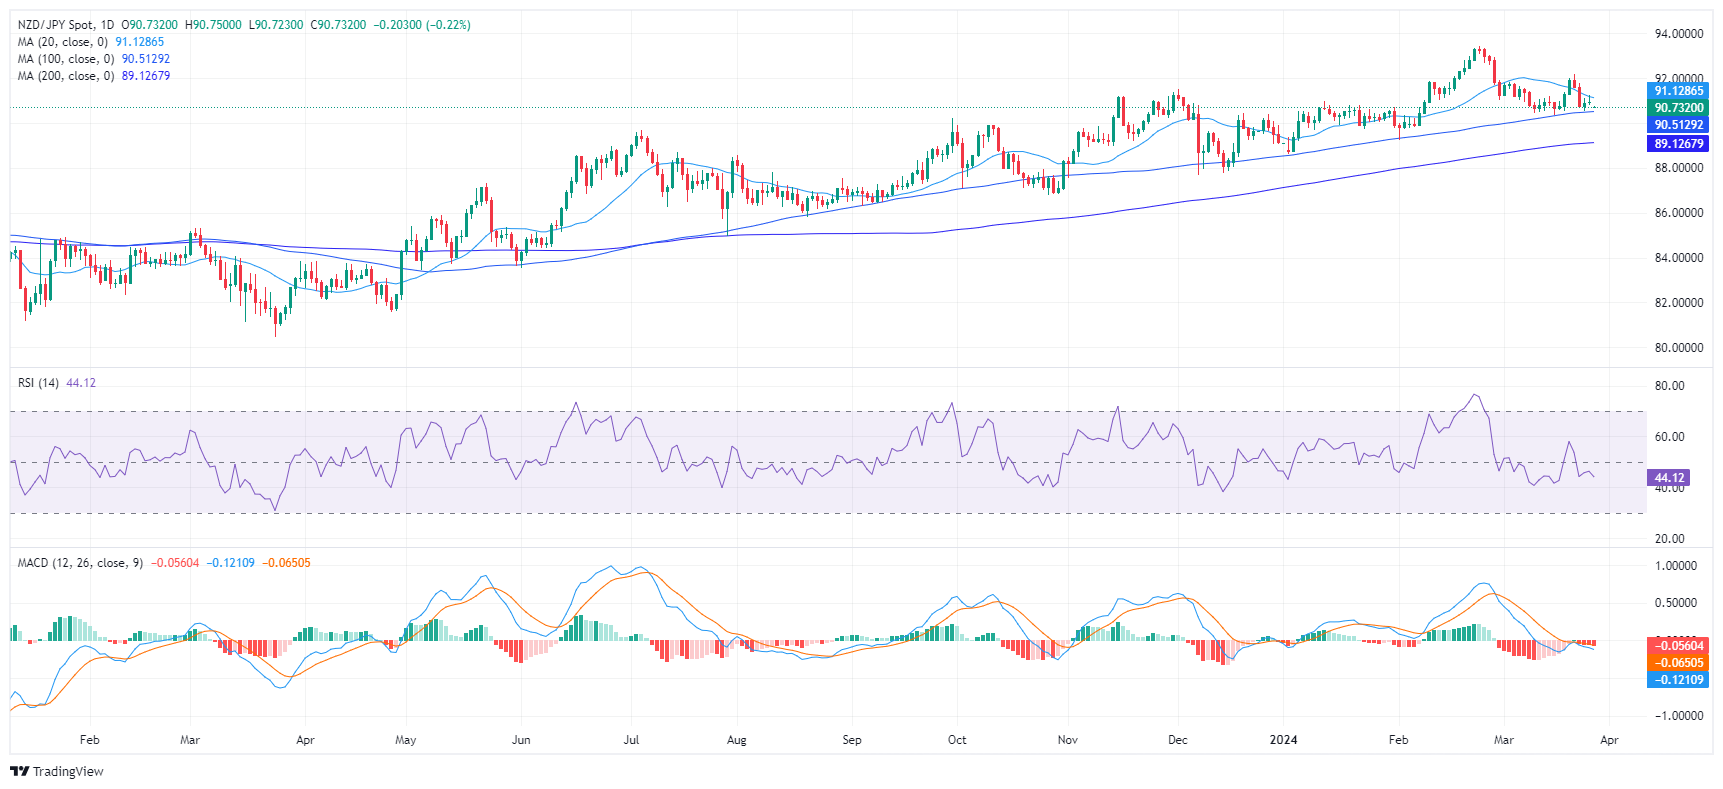
- The NZD/JPY trades neutral after getting rejected by the 20-day SMA.
- The daily chart shows that the RSI reveals weak buying traction.
- The hourly chart also showcases a similar situation with its RSI hinting at weak buying pressure.
The NZD/JPY is currently trading at 90.90, mostly neutral after trimming daily gains. From a broader perspective, the pair's position above the 100 and 200-day Simple Moving Averages (SMAs) suggests that despite the weakened buying momentum, the bulls continue to assert their control. Buyers must target the 20-day SMA to continue edging higher.
On the daily chart, the current market dynamics for the NZD/JPY pair reveal a neutral to negative trend as buyers are struggling to gather traction. The Relative Strength Index (RSI) presently resides in the negative territory. This trend is further emphasized by the red bars of the Moving Average Convergence Divergence (MACD), which reveals a steady selling momentum and weakened buying traction.
NZD/JPY daily chart
Switching to the hourly chart, the RSI recently read 41, which also positions it within negative territory. As with the daily chart, the MACD histogram on the hourly also illustrates flat red bars, further signifying weak market momentum.
NZD/JPY hourly chart
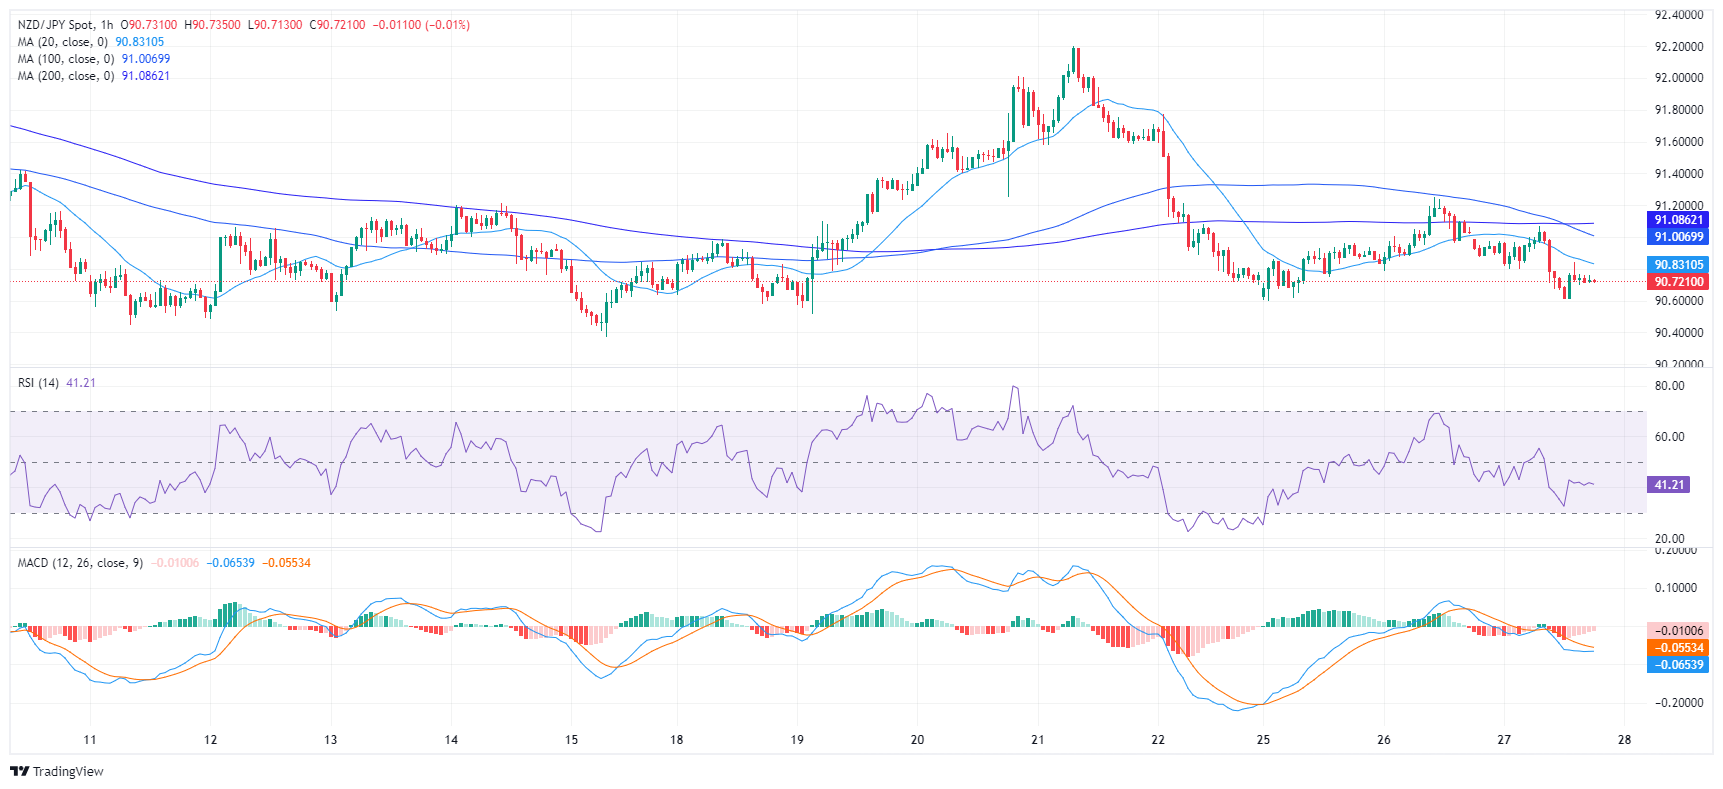
In conclusion, both the daily and hourly charts indicate a negative trend for NZD/JPY with weak buying pressure. Notwithstanding, on a larger scale, the pair remains above the 100 and 200-day Simple Moving Averages, hinting that bulls may still have broader control of the market. The negative market outlook could be further confirmed if the 20 and 100-day SMA complete a bearish crossover around the 91.00 area.


© 2000-2026. All rights reserved.
This site is managed by Teletrade D.J. LLC 2351 LLC 2022 (Euro House, Richmond Hill Road, Kingstown, VC0100, St. Vincent and the Grenadines).
The information on this website is for informational purposes only and does not constitute any investment advice.
The company does not serve or provide services to customers who are residents of the US, Canada, Iran, The Democratic People's Republic of Korea, Yemen and FATF blacklisted countries.
Making transactions on financial markets with marginal financial instruments opens up wide possibilities and allows investors who are willing to take risks to earn high profits, carrying a potentially high risk of losses at the same time. Therefore you should responsibly approach the issue of choosing the appropriate investment strategy, taking the available resources into account, before starting trading.
Use of the information: full or partial use of materials from this website must always be referenced to TeleTrade as the source of information. Use of the materials on the Internet must be accompanied by a hyperlink to teletrade.org. Automatic import of materials and information from this website is prohibited.
Please contact our PR department if you have any questions or need assistance at pr@teletrade.global.
transfers