- Analytics
- News and Tools
- Market News
- NZD/JPY Price Analysis: Bears maintain control, pushes cross below the 100-day SMA
NZD/JPY Price Analysis: Bears maintain control, pushes cross below the 100-day SMA
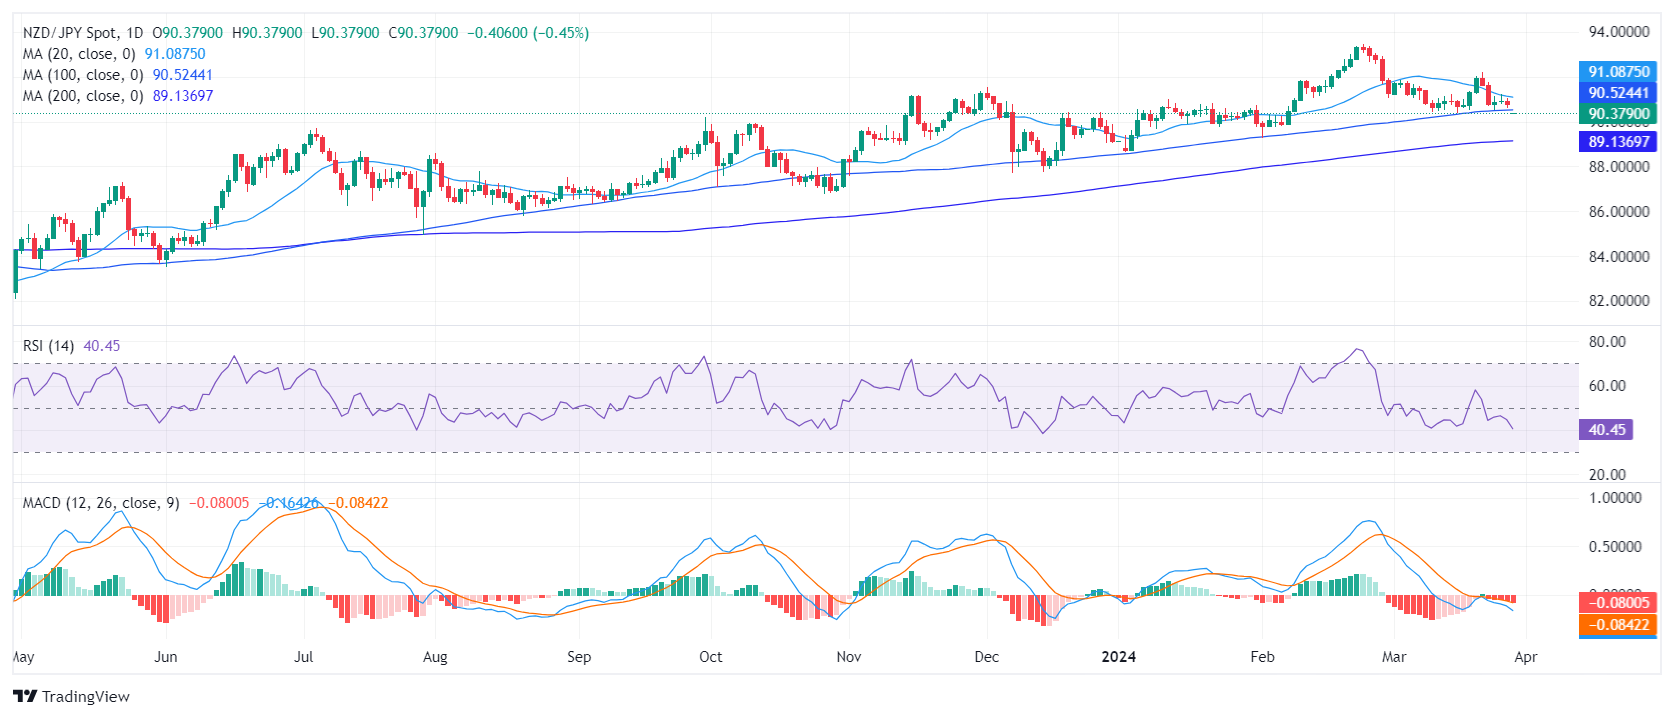
- Daily chart signals rising selling traction with the pair now below the key level of 90.50.
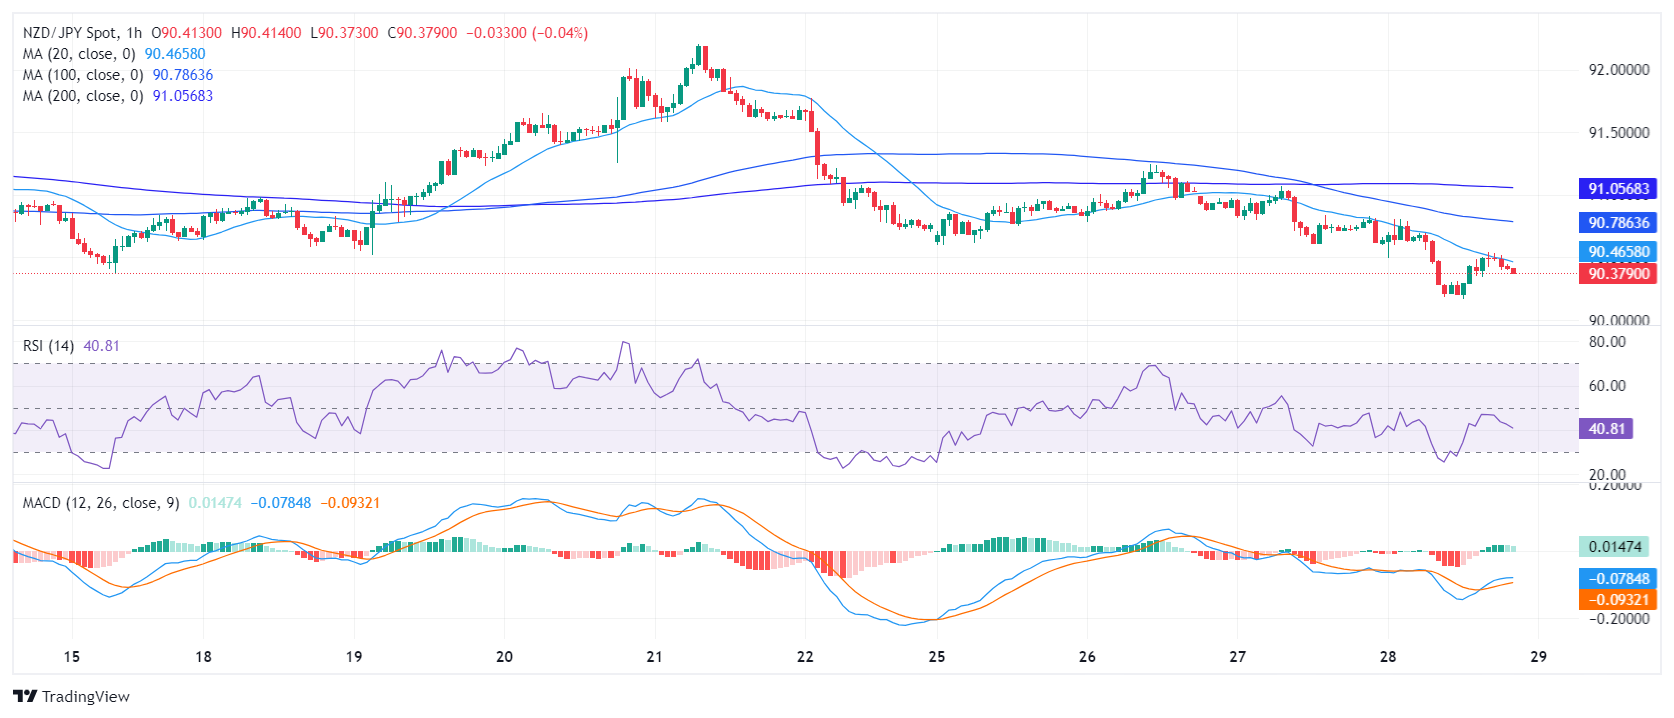
- Hourly chart indicators depict a potential consolidation period with indicators somewhat flat.
- The last hope for the cross is now the 200-day SMA.
In Thursday's session, the NZD/JPY declined to 90.40, with a decline of 0.43%. Bears are in control after successfully conquering the 100-day Simple Moving Average (SMA) while the selling momentum seems to have flattened on the hourly time frame.
On the daily chart, the NZD/JPY pair exhibits a faltering momentum. Despite intermittent upticks, the Relative Strength Index (RSI) has spent much of the last sessions in negative territory, indicating a dominance of sellers. The Moving Average Convergence Divergence (MACD) complements this view as it showcases rising red bars, pointing toward an increase in negative momentum.
NZD/JPY daily chart
Switching to the hourly chart, RSI values are mildly oscillating in the negative territory with the latest reading clocked at 42. The hourly MACD histogram adds to the complexity as it reveals green bars that suggest the downward momentum might be slowing. Comparing the daily and hourly charts, contrasting signals hint at a period of consolidation for NZD/JPY before a clearer direction emerges.
NZD/JPY hourly chart
 On a larger scale, the pair resides now below the 20 and 100-day Simple Moving Averages (SMAs), indicating bearishness. Yet, its position above the 200-day SMA adds a hint of bullish potential. However, as bearish momentum is growing, the sellers might attack the longer moving average to confirm the negative trend.


© 2000-2026. All rights reserved.
This site is managed by Teletrade D.J. LLC 2351 LLC 2022 (Euro House, Richmond Hill Road, Kingstown, VC0100, St. Vincent and the Grenadines).
The information on this website is for informational purposes only and does not constitute any investment advice.
The company does not serve or provide services to customers who are residents of the US, Canada, Iran, The Democratic People's Republic of Korea, Yemen and FATF blacklisted countries.
Making transactions on financial markets with marginal financial instruments opens up wide possibilities and allows investors who are willing to take risks to earn high profits, carrying a potentially high risk of losses at the same time. Therefore you should responsibly approach the issue of choosing the appropriate investment strategy, taking the available resources into account, before starting trading.
Use of the information: full or partial use of materials from this website must always be referenced to TeleTrade as the source of information. Use of the materials on the Internet must be accompanied by a hyperlink to teletrade.org. Automatic import of materials and information from this website is prohibited.
Please contact our PR department if you have any questions or need assistance at pr@teletrade.global.
transfers