- Analytics
- News and Tools
- Market News
- EUR/GBP Price Analysis: Bearish sentiment prevails, daily and hourly trends lean negative
EUR/GBP Price Analysis: Bearish sentiment prevails, daily and hourly trends lean negative
- The daily chart reveals a mostly bearish environment with somewhat flat indicators.
- The hourly chart analysis depicts a potential bearish shift with the RSI reading close to the neutral-negative zone.
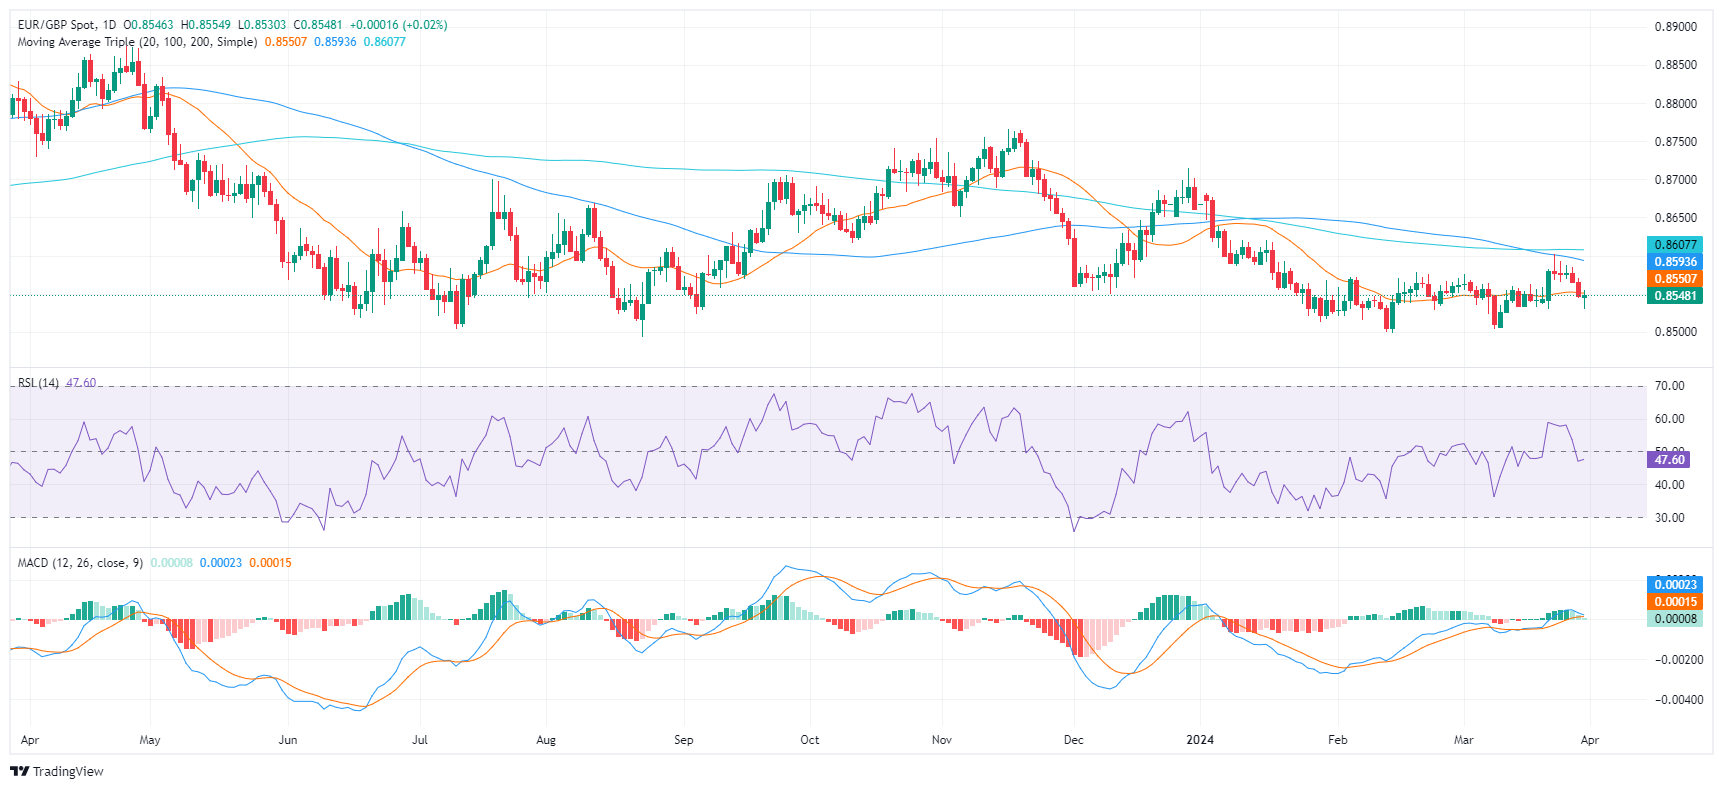
The EUR/GBP pair is currently trading at 0.8550, with minor losses on Friday’s session. The sellers are exerting their presence as bullish momentum remains weak and the fact that the cross remains below its main Simple Moving Averages (SMAs) of 20,100 and 200-days contributes to the bearish bias.
On the daily chart, the Relative Strength Index (RSI) currently resides in negative territory but stands flat while the Moving Average Convergence Divergence (MACD) prints neutral green bars, suggesting stagnant momentum. This demonstrates the trend might continue in the near term.
EUR/GBP daily chart
Moving to the hourly chart, the RSI shows a mixed trend with readings ranging from 33 and then recovering to 50 standing on the edge of the neutral-negative territory. Coupled with flat green bars on the MACD histogram, there might be a shift towards a bearish momentum after the bulls' short recovery during the European session.
EUR/GBP hourly chart
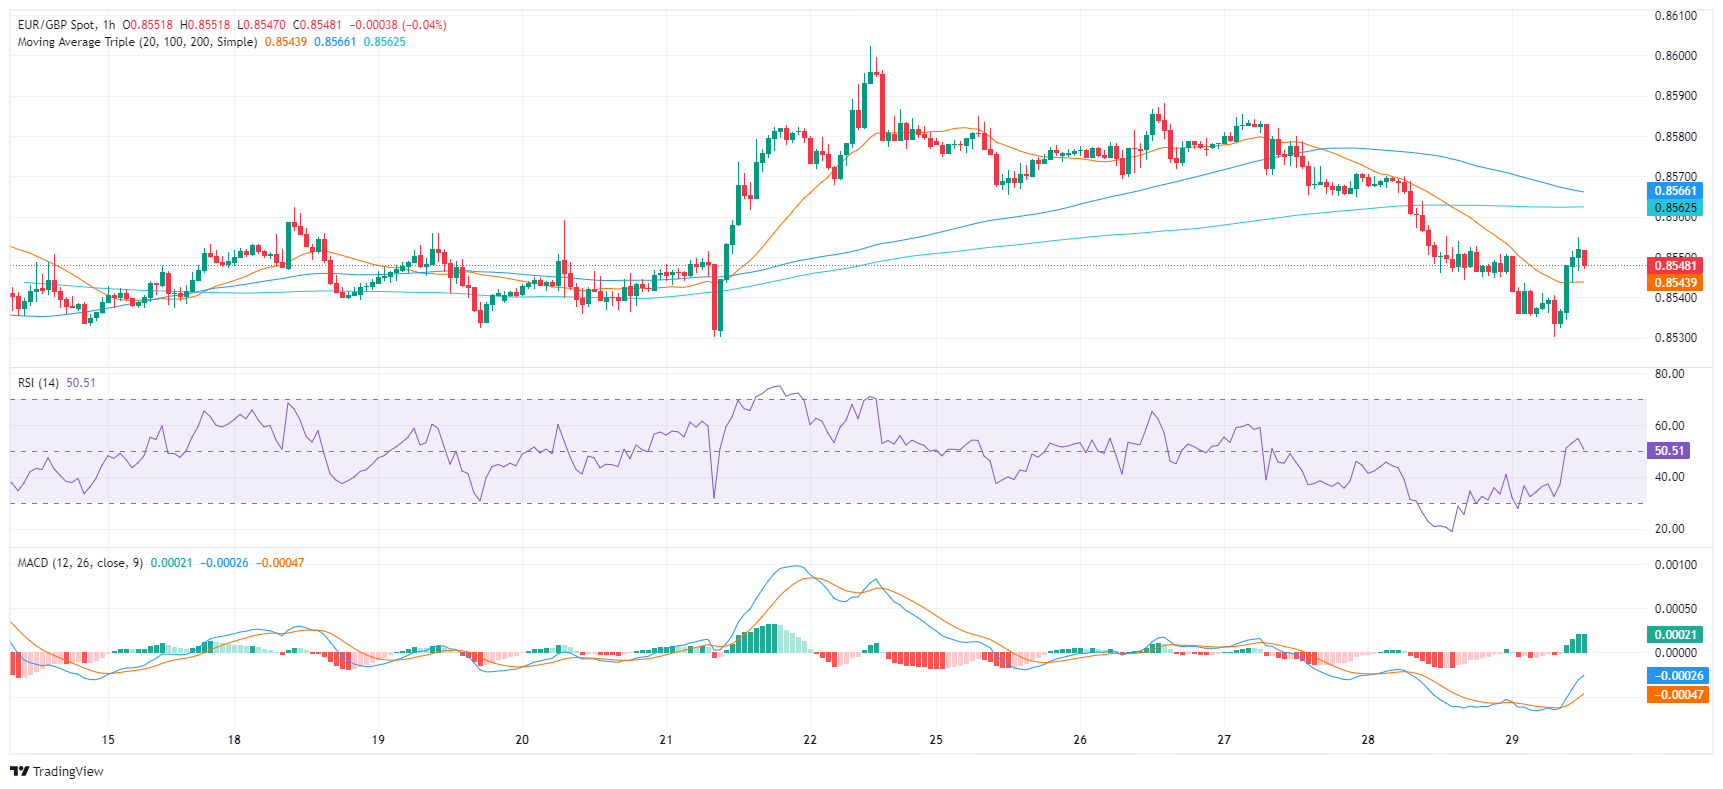
In conclusion, both the daily and hourly analyses point to a primarily negative trend for EUR/GBP, albeit with potential hourly fluctuations. If the buyers want to avoid losses they should reclaim the 200-day SMA around 0.8550 and build support around it.


© 2000-2026. All rights reserved.
This site is managed by Teletrade D.J. LLC 2351 LLC 2022 (Euro House, Richmond Hill Road, Kingstown, VC0100, St. Vincent and the Grenadines).
The information on this website is for informational purposes only and does not constitute any investment advice.
The company does not serve or provide services to customers who are residents of the US, Canada, Iran, The Democratic People's Republic of Korea, Yemen and FATF blacklisted countries.
Making transactions on financial markets with marginal financial instruments opens up wide possibilities and allows investors who are willing to take risks to earn high profits, carrying a potentially high risk of losses at the same time. Therefore you should responsibly approach the issue of choosing the appropriate investment strategy, taking the available resources into account, before starting trading.
Use of the information: full or partial use of materials from this website must always be referenced to TeleTrade as the source of information. Use of the materials on the Internet must be accompanied by a hyperlink to teletrade.org. Automatic import of materials and information from this website is prohibited.
Please contact our PR department if you have any questions or need assistance at pr@teletrade.global.
transfers