- Analytics
- News and Tools
- Market News
- EUR/JPY Price Analysis: Bears show signs of presence, long-term bullish stronghold remains unchallenged
EUR/JPY Price Analysis: Bears show signs of presence, long-term bullish stronghold remains unchallenged
- The daily chart reveals slightly bullish momentum, with RSI at 52, signifying resilient buying traction.
- Indicators in the hourly chart denote a mild downward trend, which could hint at a potential shift.
- Buyers must successfully maintain the main SMAs to mitigate bearish threats and ensure bullish continuation.
The EUR/JPY pair is currently trading at 163.13, exhibiting minimal losses. Despite the declines, the broader momentum remains bullish, but this sentiment remains finely balanced and open to fluctuations.
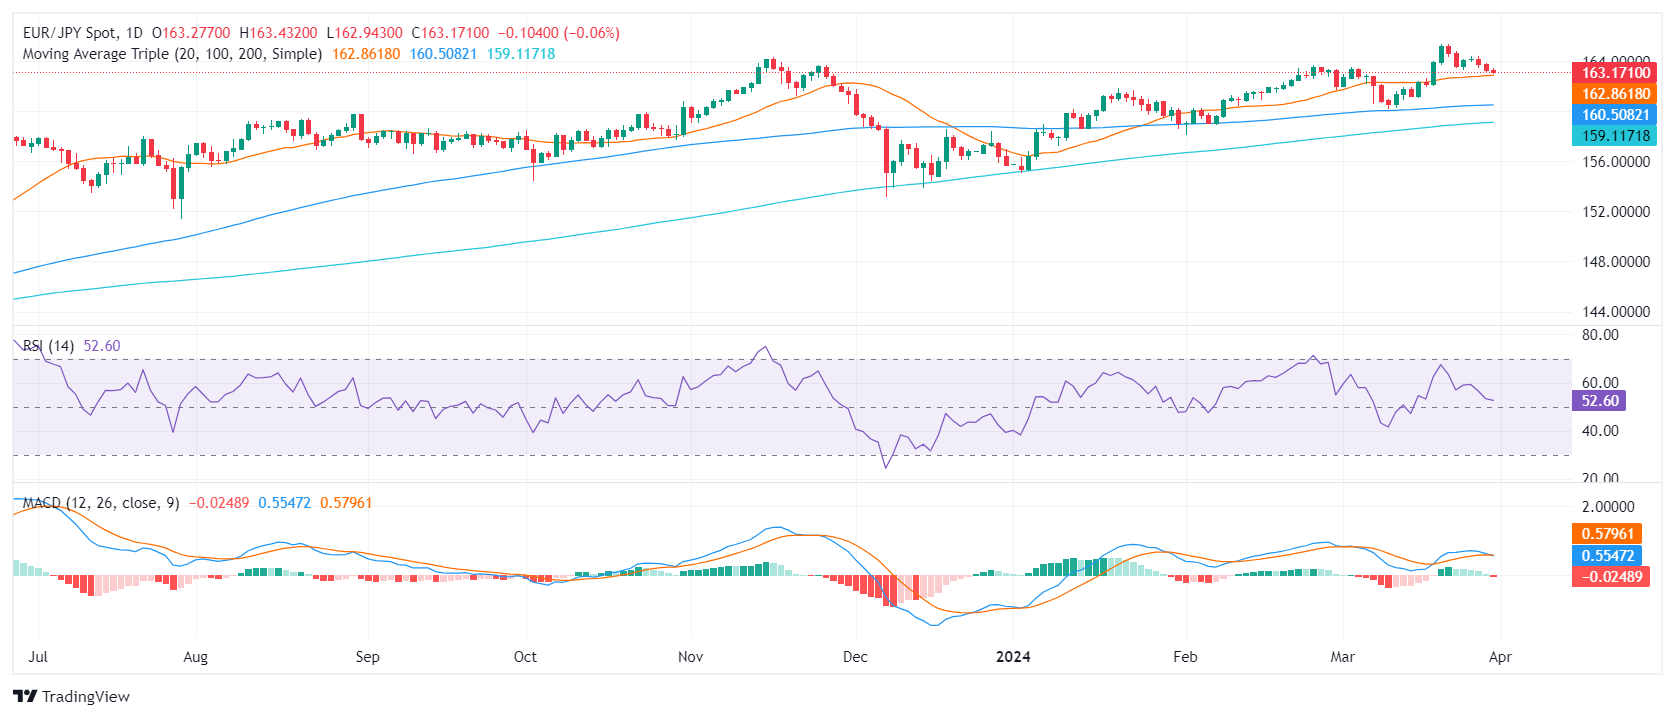
On the daily chart, the EUR/JPY pair indicates signs of a relatively positive to neutral momentum. The Relative Strength Index (RSI) has maneuvered within the positive territory over the most recent sessions, with the latest reading positioned at 52. This reading suggests a slightly bullish momentum, yet potentially susceptible to changes in market sentiment. Meanwhile, the red bar on the Moving Average Convergence Divergence (MACD) histogram suggests negative momentum, signaling that the sellers might be gearing up.
EUR/JPY daily chart
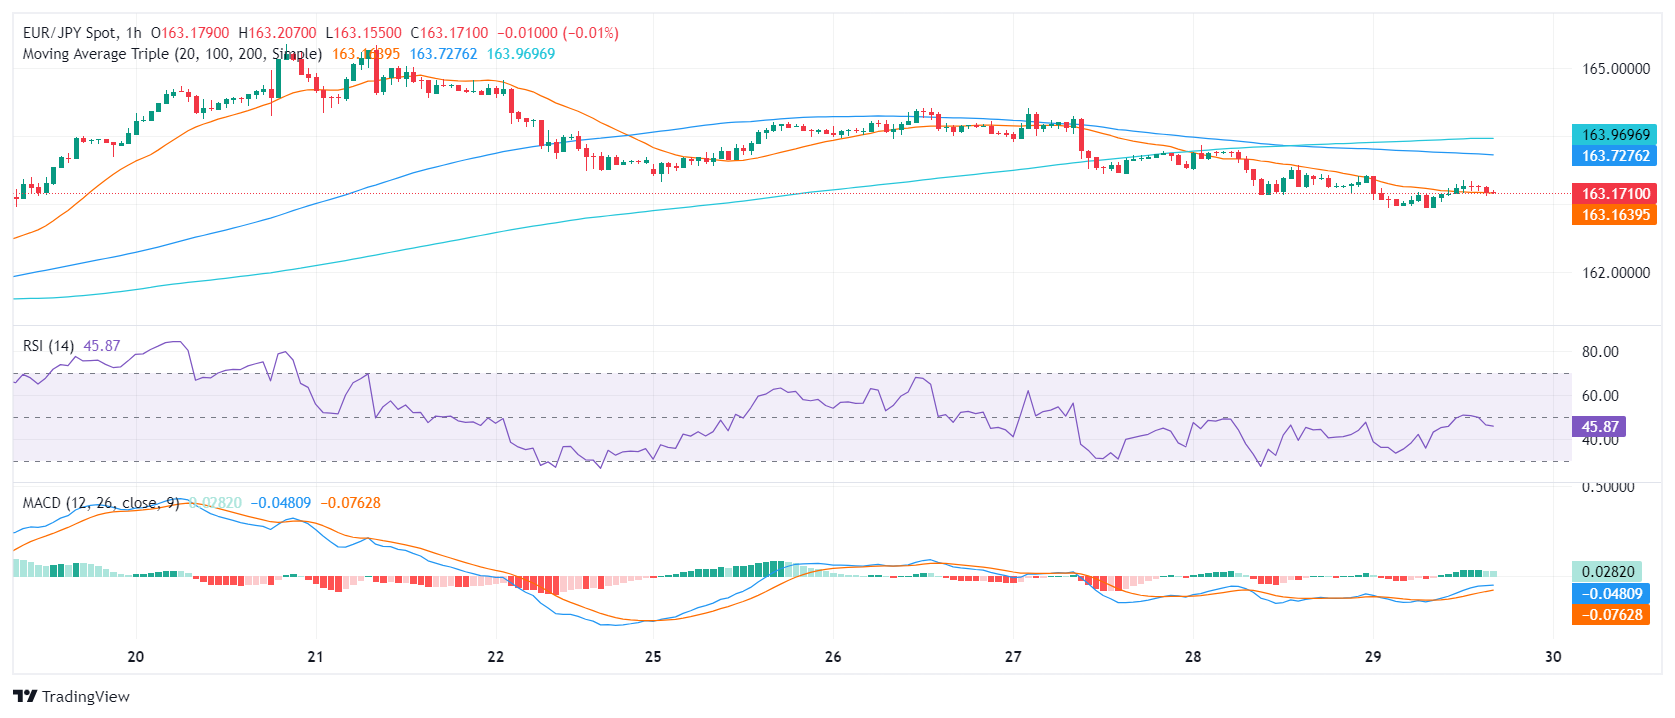
Shifting focus onto the hourly chart, fluctuations are more noticeable. The RSI values display a slight downward trend throughout the latest hours, reaching as low as 46. Alongside this, the consistently shrinking green bars of the MACD confirms the overall bearish momentum.
EUR/JPY hourly chart
In conclusion, while short-term indicators might show an inclination toward a sellers' market, it's important to note this is within a broader bullish context as seen on the daily chart. Buyers must step in and defend the 20-day SMA at 162.85 to leave the overall bullish trend intact.


© 2000-2026. All rights reserved.
This site is managed by Teletrade D.J. LLC 2351 LLC 2022 (Euro House, Richmond Hill Road, Kingstown, VC0100, St. Vincent and the Grenadines).
The information on this website is for informational purposes only and does not constitute any investment advice.
The company does not serve or provide services to customers who are residents of the US, Canada, Iran, The Democratic People's Republic of Korea, Yemen and FATF blacklisted countries.
Making transactions on financial markets with marginal financial instruments opens up wide possibilities and allows investors who are willing to take risks to earn high profits, carrying a potentially high risk of losses at the same time. Therefore you should responsibly approach the issue of choosing the appropriate investment strategy, taking the available resources into account, before starting trading.
Use of the information: full or partial use of materials from this website must always be referenced to TeleTrade as the source of information. Use of the materials on the Internet must be accompanied by a hyperlink to teletrade.org. Automatic import of materials and information from this website is prohibited.
Please contact our PR department if you have any questions or need assistance at pr@teletrade.global.
transfers