- Analytics
- News and Tools
- Market News
- EUR/JPY Price Analysis: Loses momentum under 163.00, further downside looks favorable
EUR/JPY Price Analysis: Loses momentum under 163.00, further downside looks favorable
- EUR/JPY edges lower to 162.75 amid the fear of FX intervention from the Bank of Japan (BoJ).
- The cross keeps the negative outlook below the key EMA; RSI indicator lies in bearish territory.
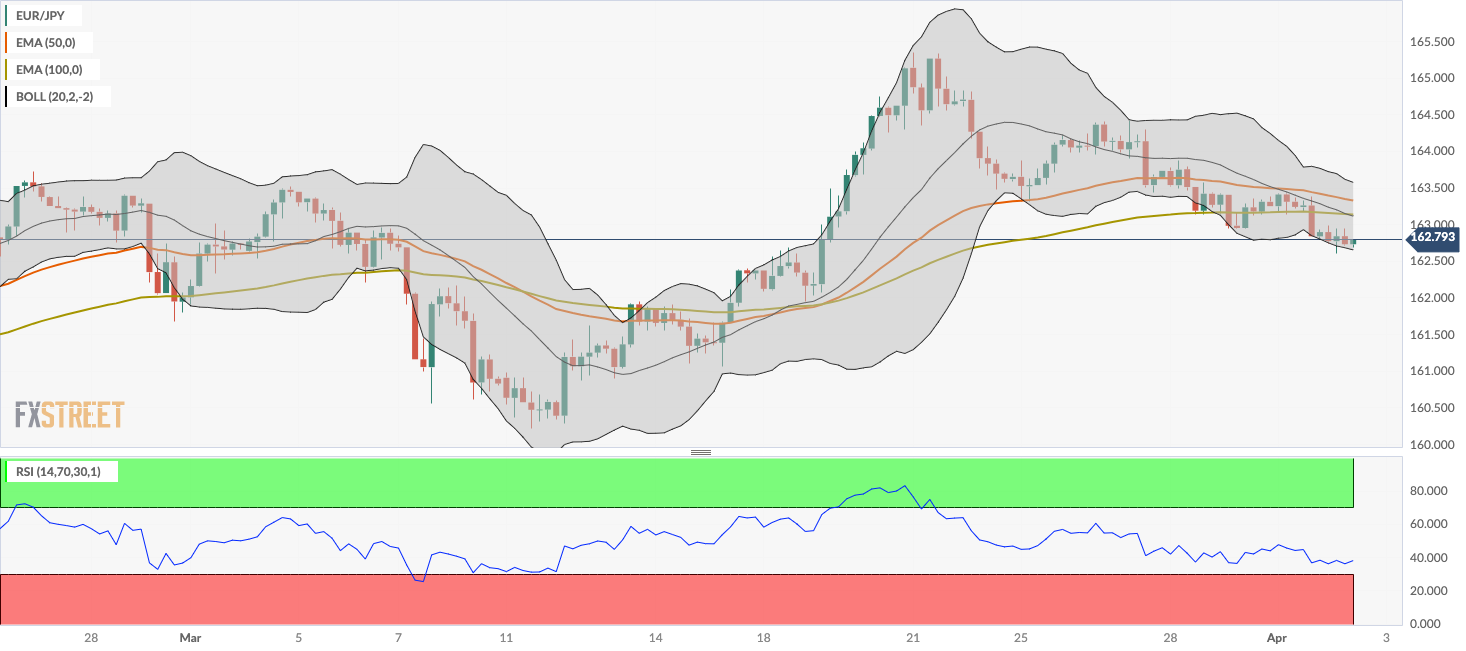
- The first upside barrier will emerge at 163.15; the first downside target is located at 162.65.
The EUR/JPY cross loses momentum near 162.75 during the early European trading hours on Tuesday. The growing speculation that the Bank of Japan (BoJ) will intervene in the foreign exchange market might support the Japanese Yen (JPY) in the near term. Early Tuesday, Japanese Finance Minister Shunichi Suzuki said that he will not rule out any steps to respond to disorderly moves and that he will monitor foreign exchange (FX) moves with a high sense of urgency.
From a technical perspective, the bearish outlook of EUR/JPY remains intact as the cross is below the 50- and 100-period Exponential Moving Averages (EMA) on the four-hour chart. The Relative Strength Index (RSI) lies in bearish territory around 36.40, supporting the sellers for the time being.
The first upside barrier for EUR/JPY will emerge near the 100-period EMA at 163.15. Further north, the next target is seen at the 50-period EMA at 163.32. A decisive break above the latter will expose the upper boundary of the Bollinger Band at 163.58. Any follow-through buying above this level would sustain its bullish move to a high of March 27 at 164.41.
On the flip side, the lower limit of the Bollinger Band at 162.65 acts as an initial support level for the cross. The key contention level is located at the 162.00 mark, representing a low of March 19 and a psychological level. A breach below 162.00 will see a drop to a low of March 14 at 161.10.
EUR/JPY four-hour chart


© 2000-2026. All rights reserved.
This site is managed by Teletrade D.J. LLC 2351 LLC 2022 (Euro House, Richmond Hill Road, Kingstown, VC0100, St. Vincent and the Grenadines).
The information on this website is for informational purposes only and does not constitute any investment advice.
The company does not serve or provide services to customers who are residents of the US, Canada, Iran, The Democratic People's Republic of Korea, Yemen and FATF blacklisted countries.
Making transactions on financial markets with marginal financial instruments opens up wide possibilities and allows investors who are willing to take risks to earn high profits, carrying a potentially high risk of losses at the same time. Therefore you should responsibly approach the issue of choosing the appropriate investment strategy, taking the available resources into account, before starting trading.
Use of the information: full or partial use of materials from this website must always be referenced to TeleTrade as the source of information. Use of the materials on the Internet must be accompanied by a hyperlink to teletrade.org. Automatic import of materials and information from this website is prohibited.
Please contact our PR department if you have any questions or need assistance at pr@teletrade.global.
transfers