- Analytics
- News and Tools
- Market News
- Silver Price Analysis: XAG/USD jumps back closer to YTD top, seems poised to climb further
Silver Price Analysis: XAG/USD jumps back closer to YTD top, seems poised to climb further
- Silver scales higher for the fourth straight day and spikes to a one-and-half-week high.
- The technical setup favours bullish traders and supports prospects for additional gains.
- Any meaningful corrective decline is likely to find decent support near the $25.00 mark.
Silver (XAG/USD) gains positive traction for the fourth straight day on Tuesday and climbs further beyond mid-$25.00s during the first half of the European session, back closer to the YTD peak touched last week.
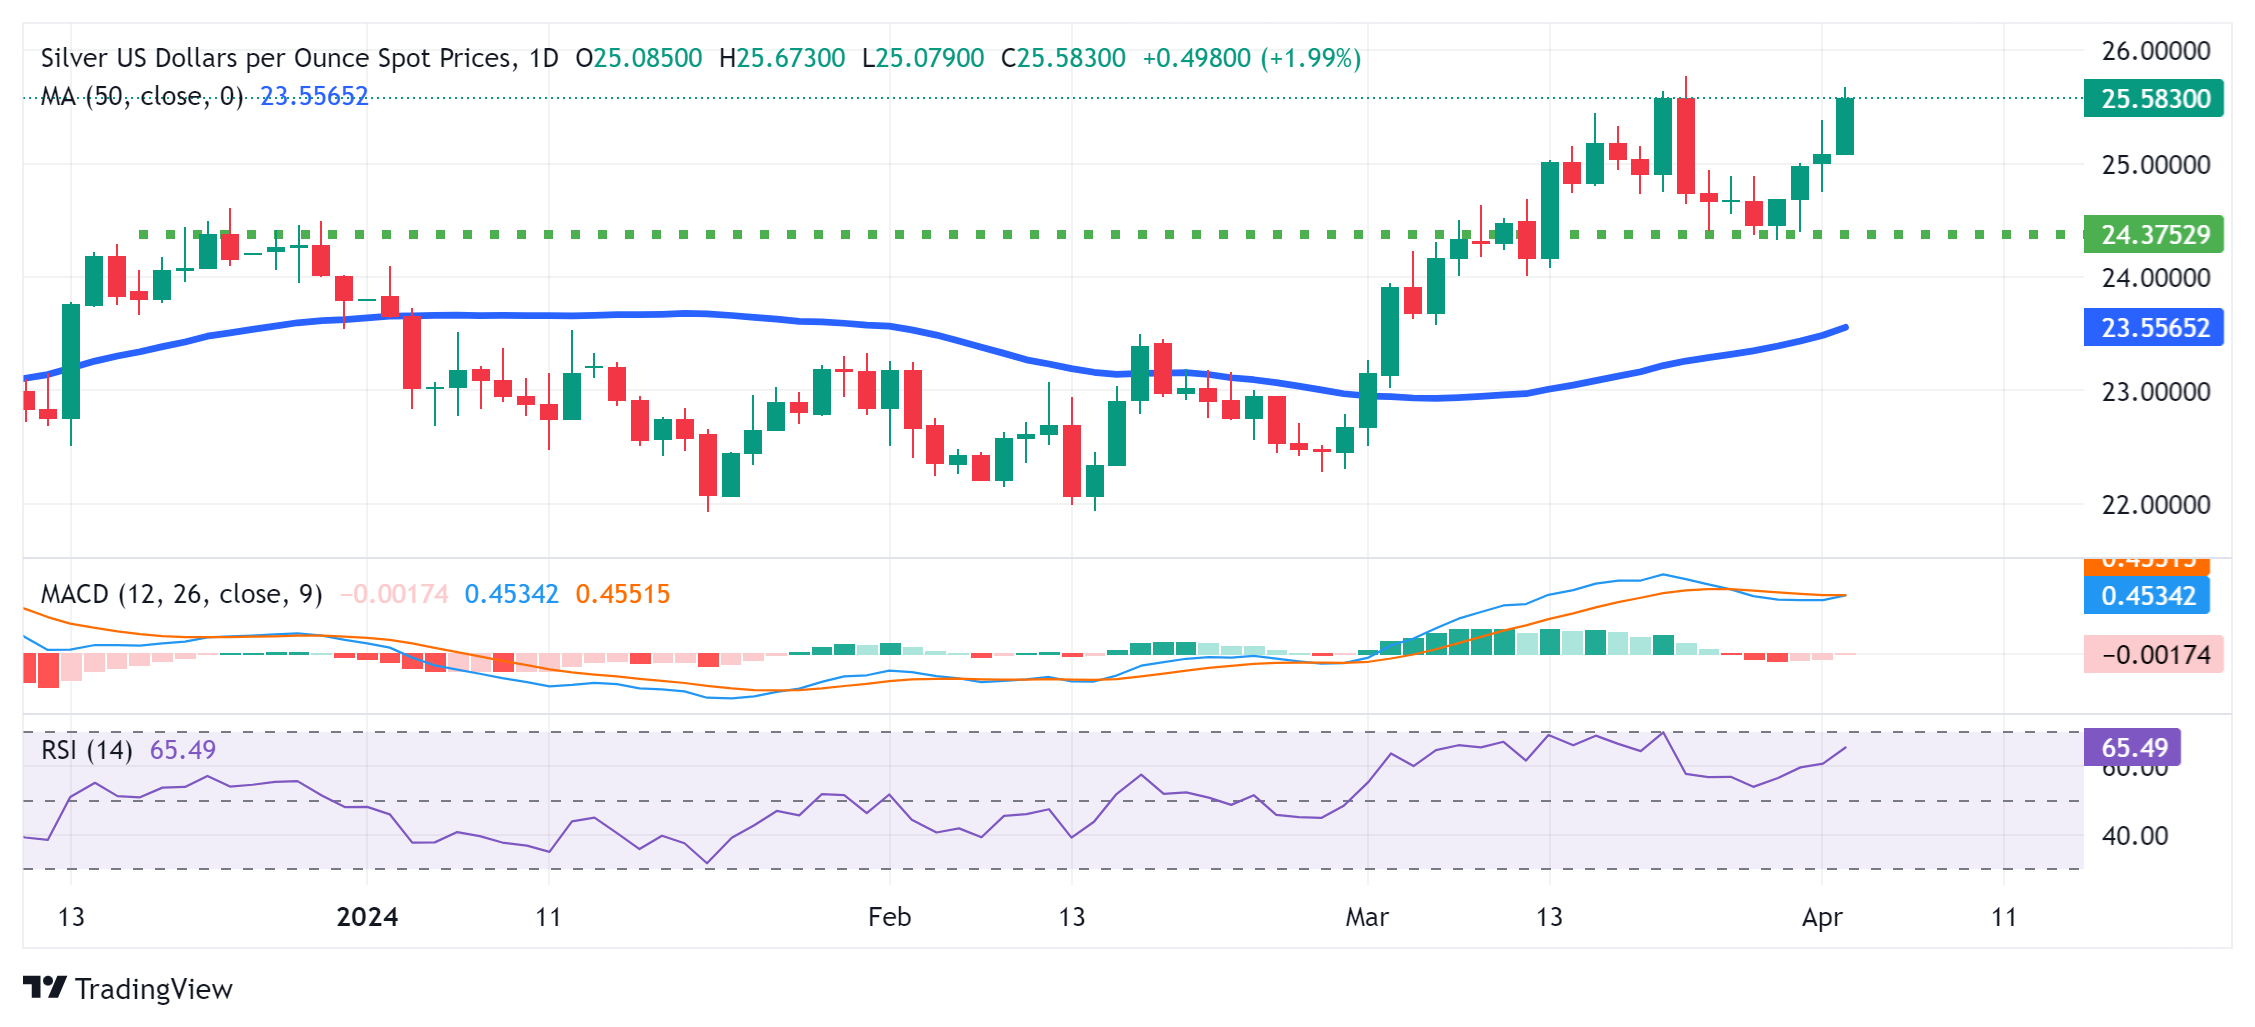
From a technical perspective, the recent bounce from the $24.35 resistance-turned-support zone and a subsequent strong move up favours bullish traders. Moreover, oscillators on the daily chart are holding in the positive territory and are still far from being in the overbought zone, suggesting that the path of least resistance for the XAG/USD is to the upside.
Hence, some follow-through strength towards testing the December 2023 swing high, just ahead of the $26.00 round figure, looks like a distinct possibility. Some follow-through buying would mark a fresh breakout and allow the XAG/USD to resume its recent strong upward trajectory witnessed since late February.
On the flip side, any meaningful corrective decline is more likely to attract fresh buyers near the $25.00 psychological mark. The next relevant support is pegged near the $24.65 region. A convincing break below the latter could drag the XAG/USD towards the aforementioned resistance-turned-support, around the $24.35 zone, which should act as a key pivotal point.
Some follow-through selling might shift the bias in favour of bearish traders and make the XAG/USD vulnerable to accelerate the decline further towards the $24.15-$24.10 region. The white metal could eventually weaken below the $24.00 round-figure mark, towards the 50-day Simple Moving Average (SMA), currently pegged near the $23.60 zone.
Silver daily chart


© 2000-2026. All rights reserved.
This site is managed by Teletrade D.J. LLC 2351 LLC 2022 (Euro House, Richmond Hill Road, Kingstown, VC0100, St. Vincent and the Grenadines).
The information on this website is for informational purposes only and does not constitute any investment advice.
The company does not serve or provide services to customers who are residents of the US, Canada, Iran, The Democratic People's Republic of Korea, Yemen and FATF blacklisted countries.
Making transactions on financial markets with marginal financial instruments opens up wide possibilities and allows investors who are willing to take risks to earn high profits, carrying a potentially high risk of losses at the same time. Therefore you should responsibly approach the issue of choosing the appropriate investment strategy, taking the available resources into account, before starting trading.
Use of the information: full or partial use of materials from this website must always be referenced to TeleTrade as the source of information. Use of the materials on the Internet must be accompanied by a hyperlink to teletrade.org. Automatic import of materials and information from this website is prohibited.
Please contact our PR department if you have any questions or need assistance at pr@teletrade.global.
transfers