- Analytics
- News and Tools
- Market News
- NZD/JPY Price Analysis: Bears hold the upperhand, bearish SMA crossover might intensify momentum
NZD/JPY Price Analysis: Bears hold the upperhand, bearish SMA crossover might intensify momentum
- The RSI on the daily chart lies deep in negative terrain.
- Inidicators on the hourly chart are showing a slight improvement.
- The 20 and 100-day SMAs are about to complete a bearish crossover around 91.00.
In Tuesday's session, the NZD/JPY pair is trading with a slight rise to 90.42, marking a 0.16% gain. Despite this, sellers retain dominance within the broader market scenario, hinting towards an entrenched bearish sentiment. Encouragingly though, hourly data suggests the potential for short-term bullish corrections, indicating a touch of buyer resilience.
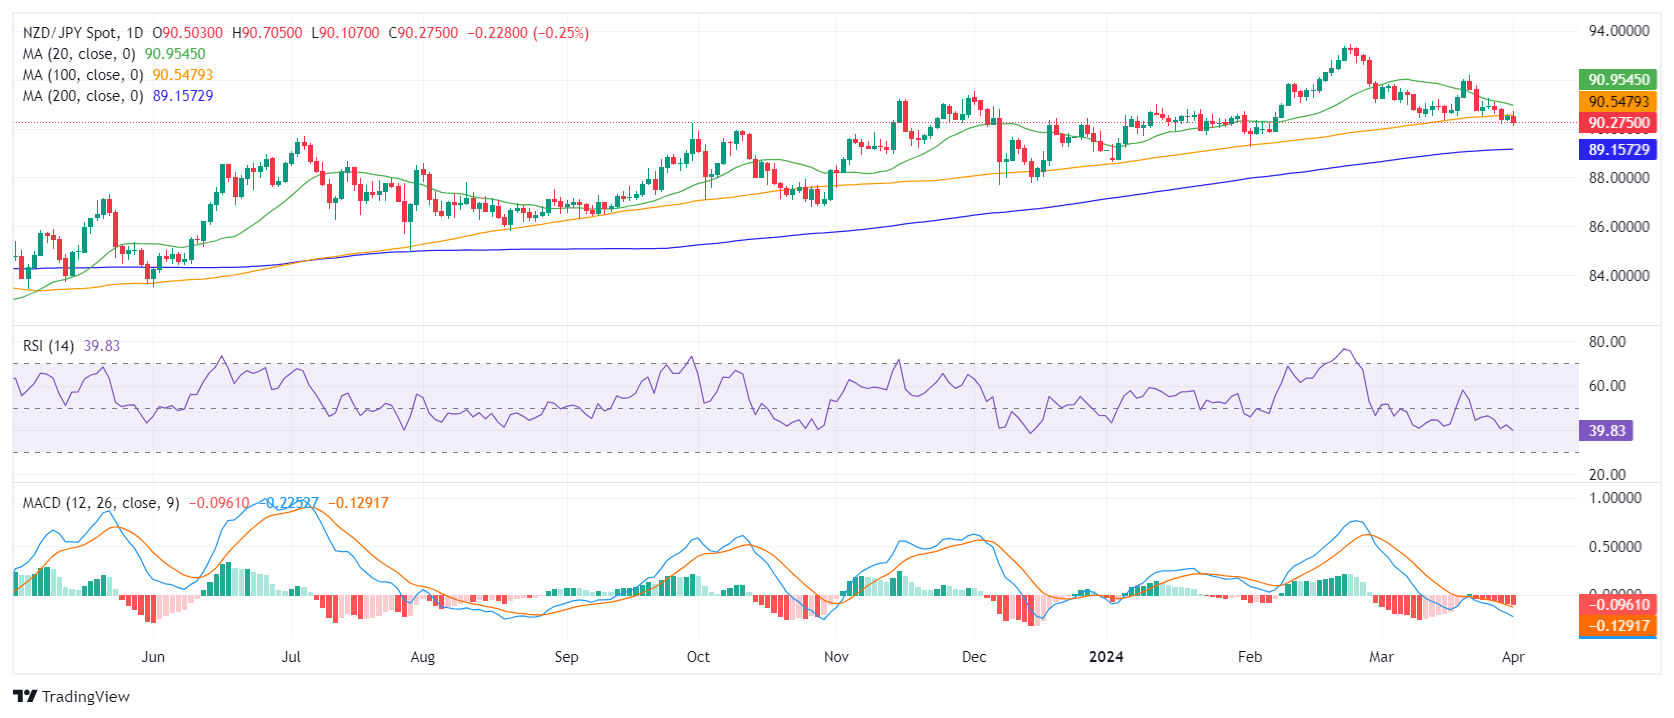
On the daily chart, the Relative Strength Index (RSI) shows a predominantly negative trend, remaining in the negative territory in the last sessions. Concurrently, the Moving Average Convergence Divergence (MACD) histogram reveals rising red bars, indicating a rising negative momentum.
NZD/JPY daily chart
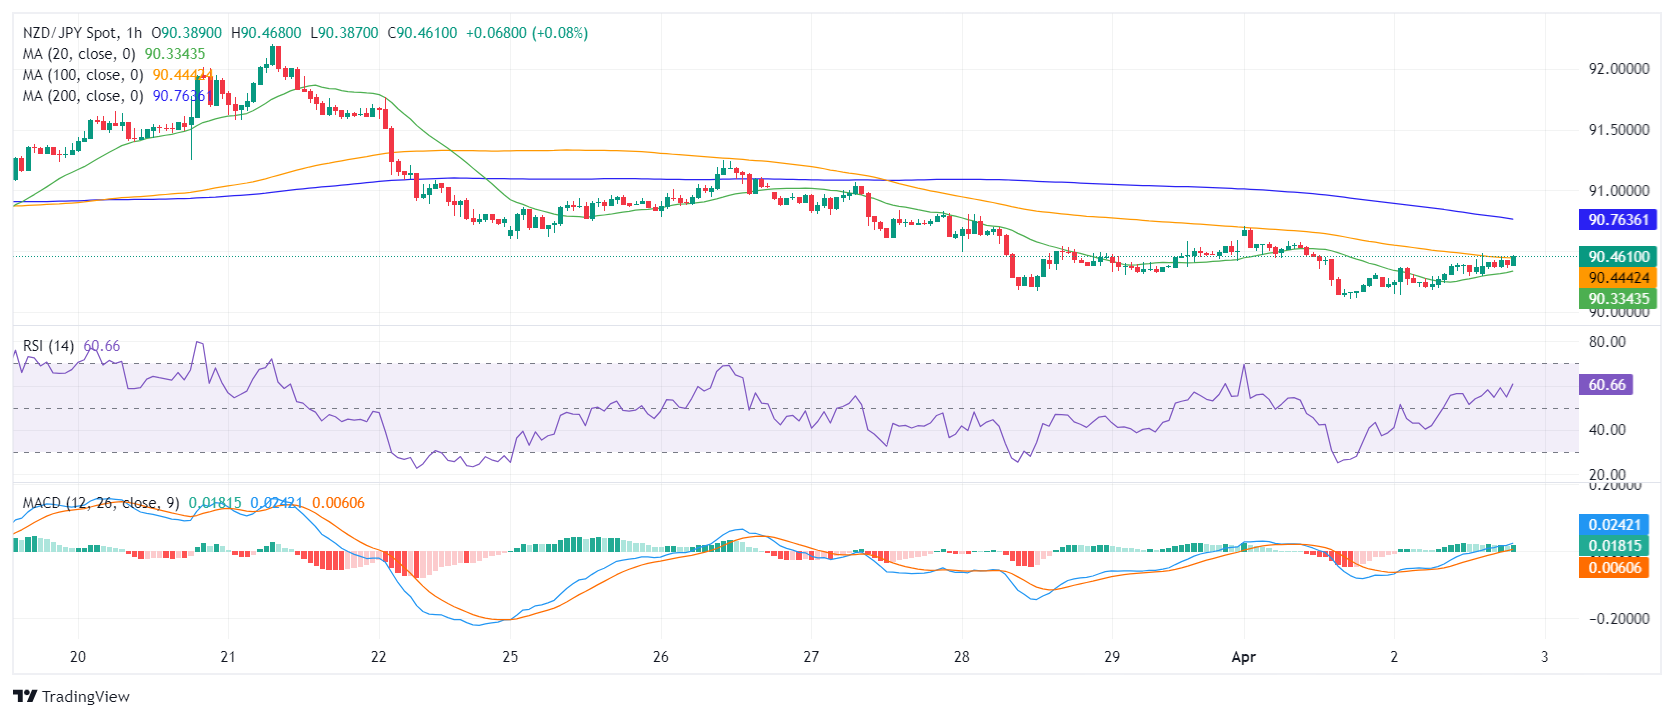
Moving on to the hourly chart, RSI values are inclining more towards the positive side, with the recent readings registered at 53. This shift may hint at a short-term gain in buyers' momentum. In addition, the hourly MACD histogram displays green bars, adding arguments for the recovering bullish momentum.
NZD/JPY hourly chart
Upon examining the broader perspective, the NZD/JPY has showcased significant bearish tendencies as its sits below its 20, 100 and 200-day Simple Moving Averages (SMA). In addition, a bearish crossover of the 20 and 100-day SMA at around 91.00 could precipitate even sharper declines.
Summarizing, sellers seem to have control over the NZD/JPY pair's direction on the daily chart. However, recent hourly data indicates potential short-term bullish corrections. Nevertheless, the prevailing trend is inclined towards further weakness, reinforced by the SMA positioning, and a potential bearish crossover.


© 2000-2026. All rights reserved.
This site is managed by Teletrade D.J. LLC 2351 LLC 2022 (Euro House, Richmond Hill Road, Kingstown, VC0100, St. Vincent and the Grenadines).
The information on this website is for informational purposes only and does not constitute any investment advice.
The company does not serve or provide services to customers who are residents of the US, Canada, Iran, The Democratic People's Republic of Korea, Yemen and FATF blacklisted countries.
Making transactions on financial markets with marginal financial instruments opens up wide possibilities and allows investors who are willing to take risks to earn high profits, carrying a potentially high risk of losses at the same time. Therefore you should responsibly approach the issue of choosing the appropriate investment strategy, taking the available resources into account, before starting trading.
Use of the information: full or partial use of materials from this website must always be referenced to TeleTrade as the source of information. Use of the materials on the Internet must be accompanied by a hyperlink to teletrade.org. Automatic import of materials and information from this website is prohibited.
Please contact our PR department if you have any questions or need assistance at pr@teletrade.global.
transfers