- Analytics
- News and Tools
- Market News
- AUD/JPY Price Analysis: Aussie soars, buyers start to back off on the hourly chart
AUD/JPY Price Analysis: Aussie soars, buyers start to back off on the hourly chart
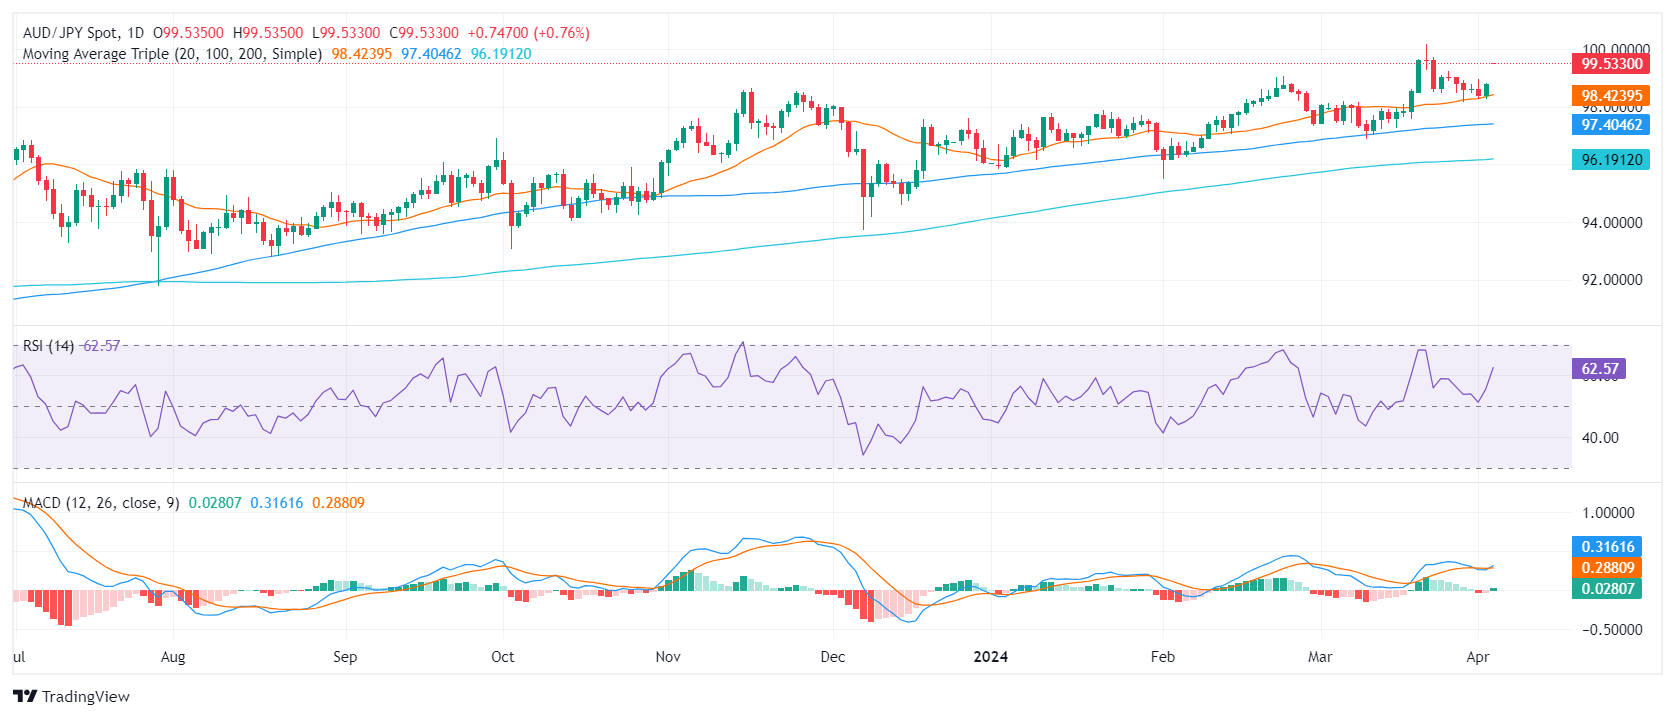
- The daily chart presents a strong buying momentum with indicators deep in positive territory.
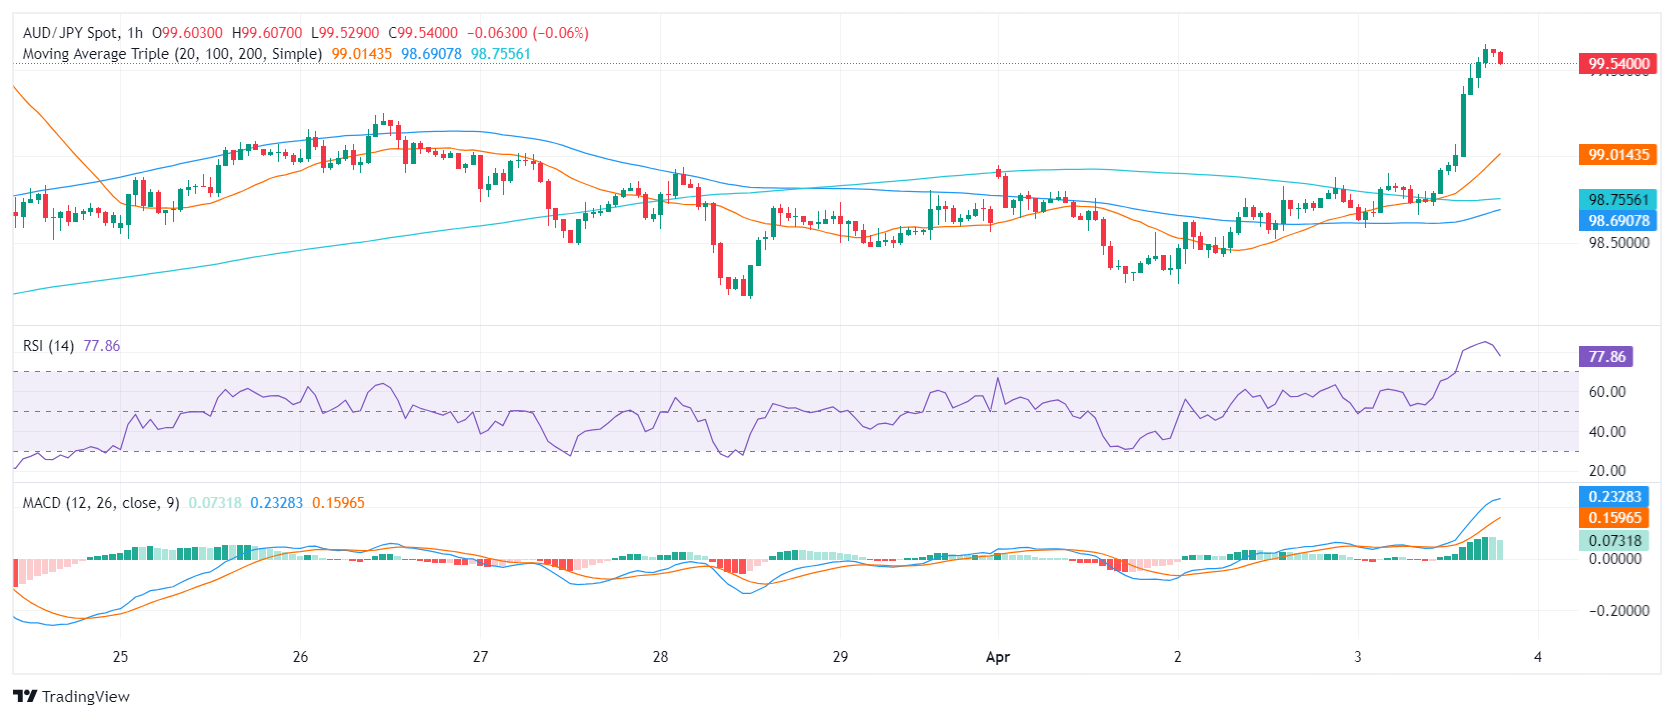
- On the hourly chart, the RSI resides in the overbought zone, suggesting a short-term consolidation of the recent gains.
In Wednesday's session, the AUD/JPY pair is trading at 99.58, following an increase of 0.82%. Buyers appear in control, but indicators are flashing signals of a short-term consolidation.
On the daily chart, the AUD/JPY pair reveals a bullish sentiment. The Relative Strength Index (RSI) resides deep in positive territory, with recent readings reaching as high as 61, indicating the domination of buyers in the market. Furthermore, the rising green bars on the Moving Average Convergence Divergence (MACD) histogram show a positive momentum, supporting the bullish outlook.
AUD/JPY daily chart
Upon inspecting the hourly chart, the RSI readings consistently hover in the overbought zone, with the latest entry at 78 but the index has started to edge downwards. A flat green histogram on the MACD also gives arguments for a short-term consolidation.
AUD/JPY hourly chart
Considering the broader outlook, the pair also stands above the 20,100 and 200-day Simple Moving Averages (SMAs). This setup suggests short-term and long-term trends are bullish, and traders may expect further upside.
In conclusion, both daily and hourly charts for the AUD/JPY pair highlight a bullish outlook. The RSI values and the MACD histograms across both timelines point to strong upward movement, with buyers currently holding market reins. However, indicators on the hourly chart point to further consolidation as they lie deep in the overbought zone.


© 2000-2026. All rights reserved.
This site is managed by Teletrade D.J. LLC 2351 LLC 2022 (Euro House, Richmond Hill Road, Kingstown, VC0100, St. Vincent and the Grenadines).
The information on this website is for informational purposes only and does not constitute any investment advice.
The company does not serve or provide services to customers who are residents of the US, Canada, Iran, The Democratic People's Republic of Korea, Yemen and FATF blacklisted countries.
Making transactions on financial markets with marginal financial instruments opens up wide possibilities and allows investors who are willing to take risks to earn high profits, carrying a potentially high risk of losses at the same time. Therefore you should responsibly approach the issue of choosing the appropriate investment strategy, taking the available resources into account, before starting trading.
Use of the information: full or partial use of materials from this website must always be referenced to TeleTrade as the source of information. Use of the materials on the Internet must be accompanied by a hyperlink to teletrade.org. Automatic import of materials and information from this website is prohibited.
Please contact our PR department if you have any questions or need assistance at pr@teletrade.global.
transfers