- Analytics
- News and Tools
- Market News
- NZD/USD Price Analysis: Kiwi bulls find some light, bears command the broader stage
NZD/USD Price Analysis: Kiwi bulls find some light, bears command the broader stage
- The daily RSI recovered from near-oversold levels.
- The hourly chart indicators exhibited a sharp uptick with the RSI above 70.
- Buyers need to breach the key 20-day SMA for further ascents.
The NZD/USD was trading around the 0.6000 zone during Wednesday's session, reflecting an increase of 0.55%. The technical outlook indicates that sellers have had a more significant influence on the market. Nevertheless, buying momentum grew during the session as the Greenback was one of the weakest performers due to fundamental reasons.
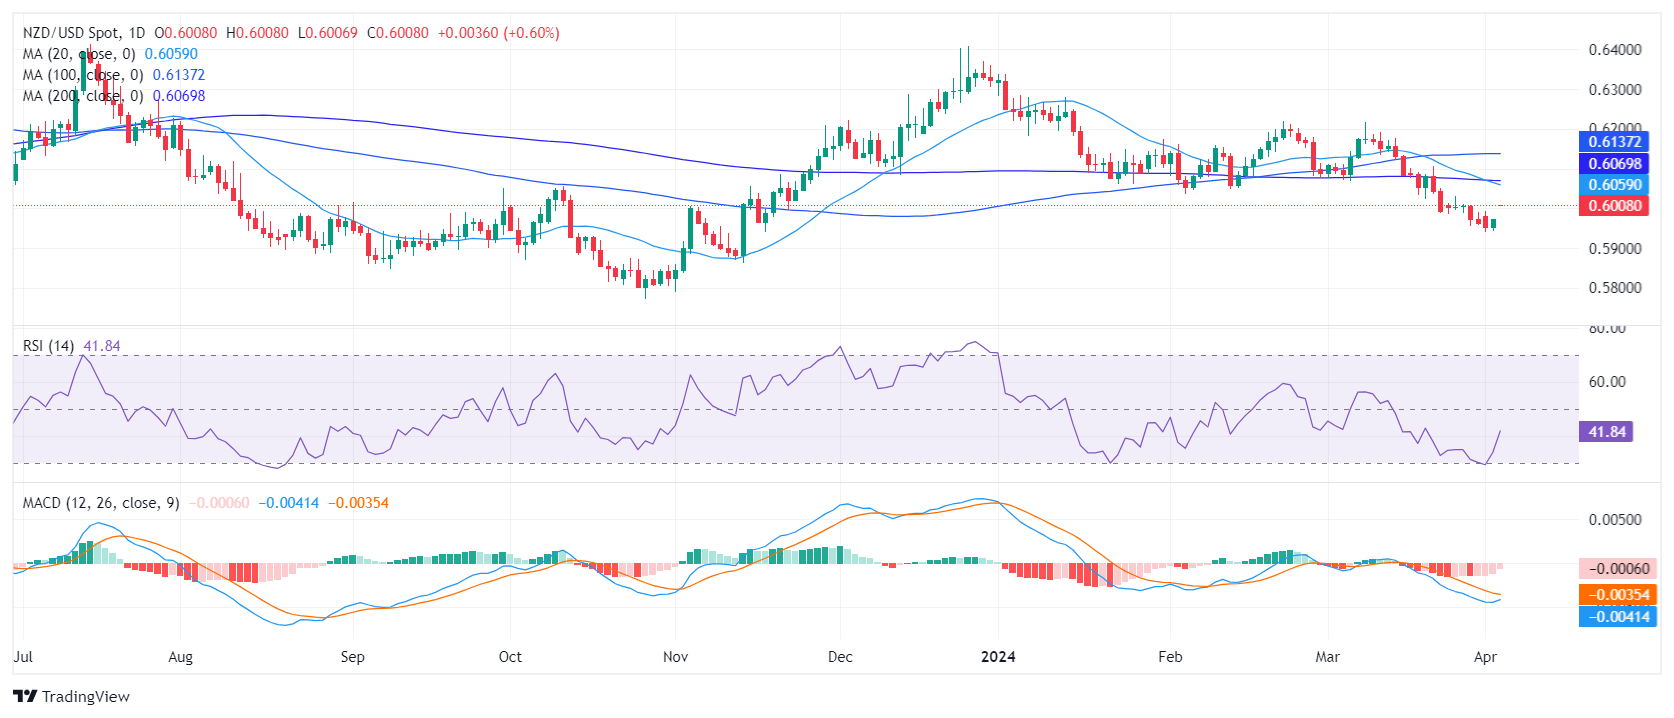
On the daily chart, the Relative Strength Index (RSI) predominantly exists in negative territory, despite Wednesday’s recovery from oversold areas, and currently stands at 44. This indicates that stronger market influence is currently in the hands of sellers despite the slight recovery.
NZD/USD daily chart
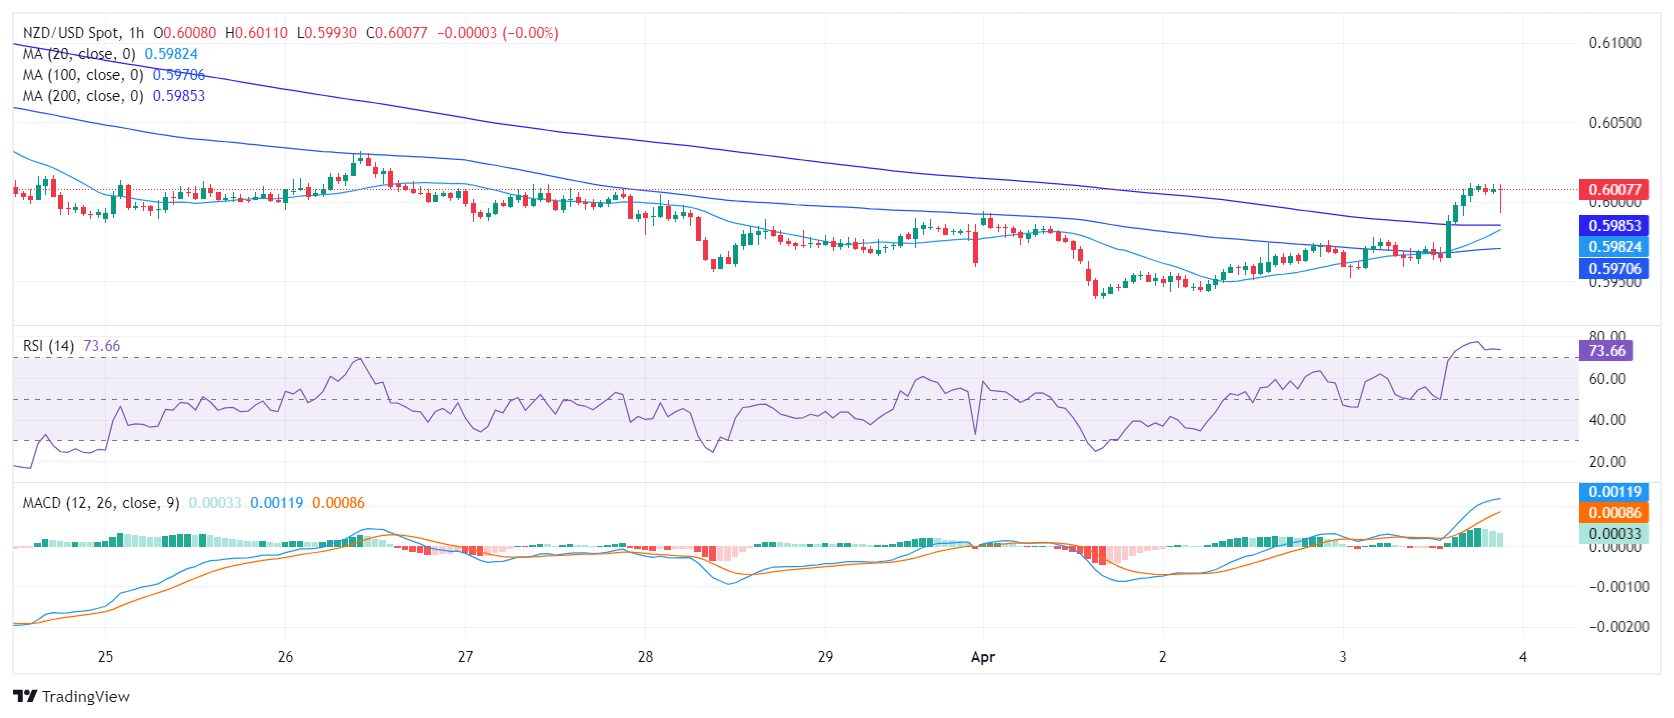
Turning to the hourly chart, an upward trend in the RSI was observed, reaching a peak at 76 before falling slightly to 71 as investors took some profits. At the same time, the Moving Average Convergence Divergence (MACD) histogram exhibited flat green bars, hinting at a waning short-term momentum. Despite an active sellers' market on the daily chart, the hourly indicators suggest a more balanced market with potential opportunities for buyers.
NZD/USD hourly chart
Broadly speaking, the NZD/USD is currently performing under a bearish signal across all Simple Moving Averages (SMA) as it trades below its 20,100-day, and 200-day averages. The completed SMA crossover between the 20 and 200-day averages adds arguments for a negative outlook and could limit the pair's upside.


© 2000-2026. All rights reserved.
This site is managed by Teletrade D.J. LLC 2351 LLC 2022 (Euro House, Richmond Hill Road, Kingstown, VC0100, St. Vincent and the Grenadines).
The information on this website is for informational purposes only and does not constitute any investment advice.
The company does not serve or provide services to customers who are residents of the US, Canada, Iran, The Democratic People's Republic of Korea, Yemen and FATF blacklisted countries.
Making transactions on financial markets with marginal financial instruments opens up wide possibilities and allows investors who are willing to take risks to earn high profits, carrying a potentially high risk of losses at the same time. Therefore you should responsibly approach the issue of choosing the appropriate investment strategy, taking the available resources into account, before starting trading.
Use of the information: full or partial use of materials from this website must always be referenced to TeleTrade as the source of information. Use of the materials on the Internet must be accompanied by a hyperlink to teletrade.org. Automatic import of materials and information from this website is prohibited.
Please contact our PR department if you have any questions or need assistance at pr@teletrade.global.
transfers