- Analytics
- News and Tools
- Market News
- NZD/JPY Price Analysis: Bearish reversal cues emerge, buyers give up gains
NZD/JPY Price Analysis: Bearish reversal cues emerge, buyers give up gains
- The daily chart signifies a bullish market; yet, the hourly chart shows hints of a short-term bearish reversal.
- The NZD significantly weakened during the American session and cleared daily gains.
- The hourly RSI dived from the overbought area near oversold terrain.
The NZD/JPY cleared all of its daily gains and fell by nearly 0.75% during the American session. Bearish clues emerge on the hourly chart, but the daily technical outlook remains somewhat bullish.
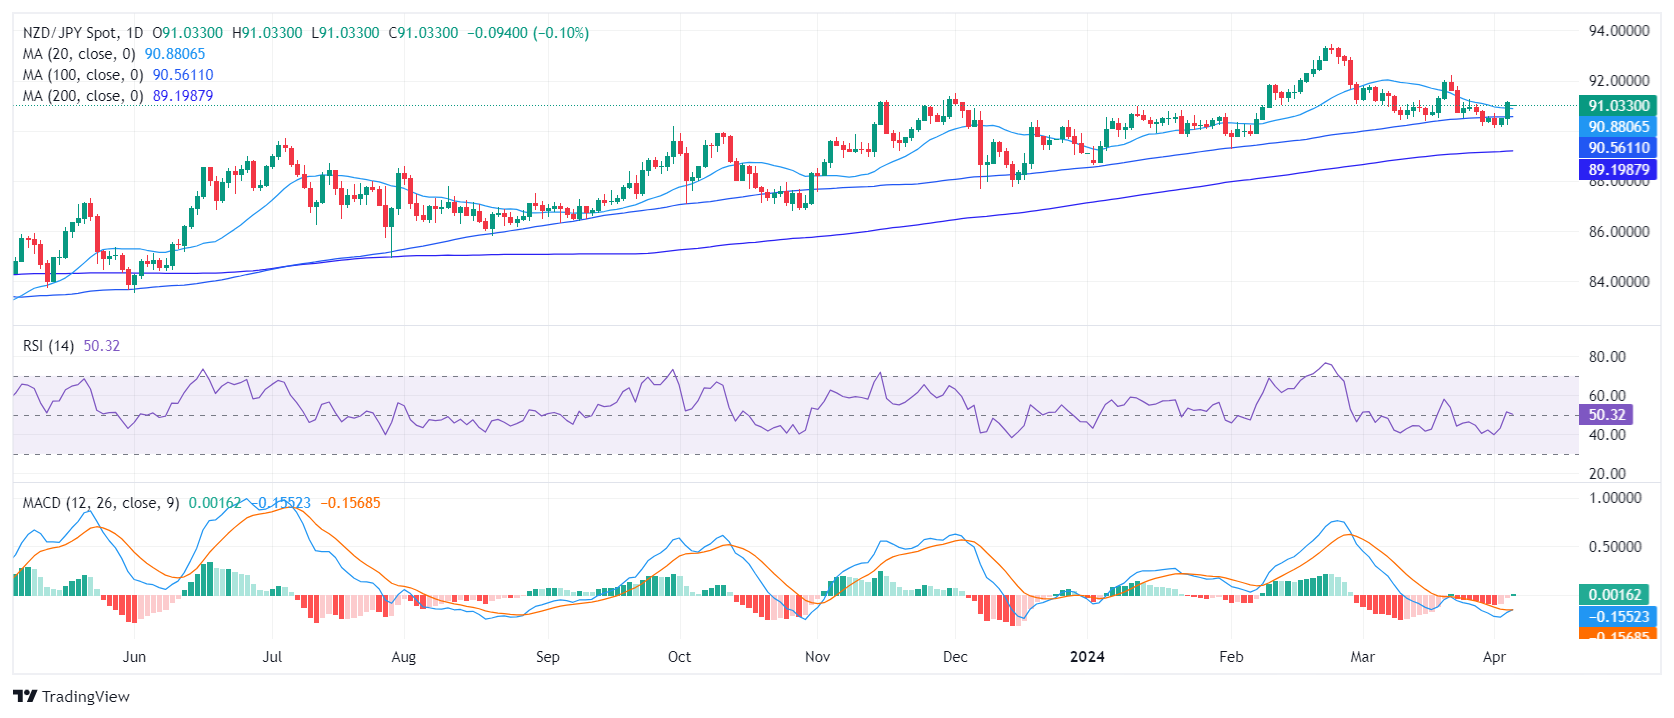
On the daily chart, the NZD/JPY Relative Strength Index (RSI) reveals its latest reading, slightly shifting towards a positive trend. The value is edging past the 50 mark after a period of predominantly being in negative terrain. However, with the latest RSI reading barely past 50, the momentum can still be seen as not strongly favoring the buyers.
NZD/JPY daily chart
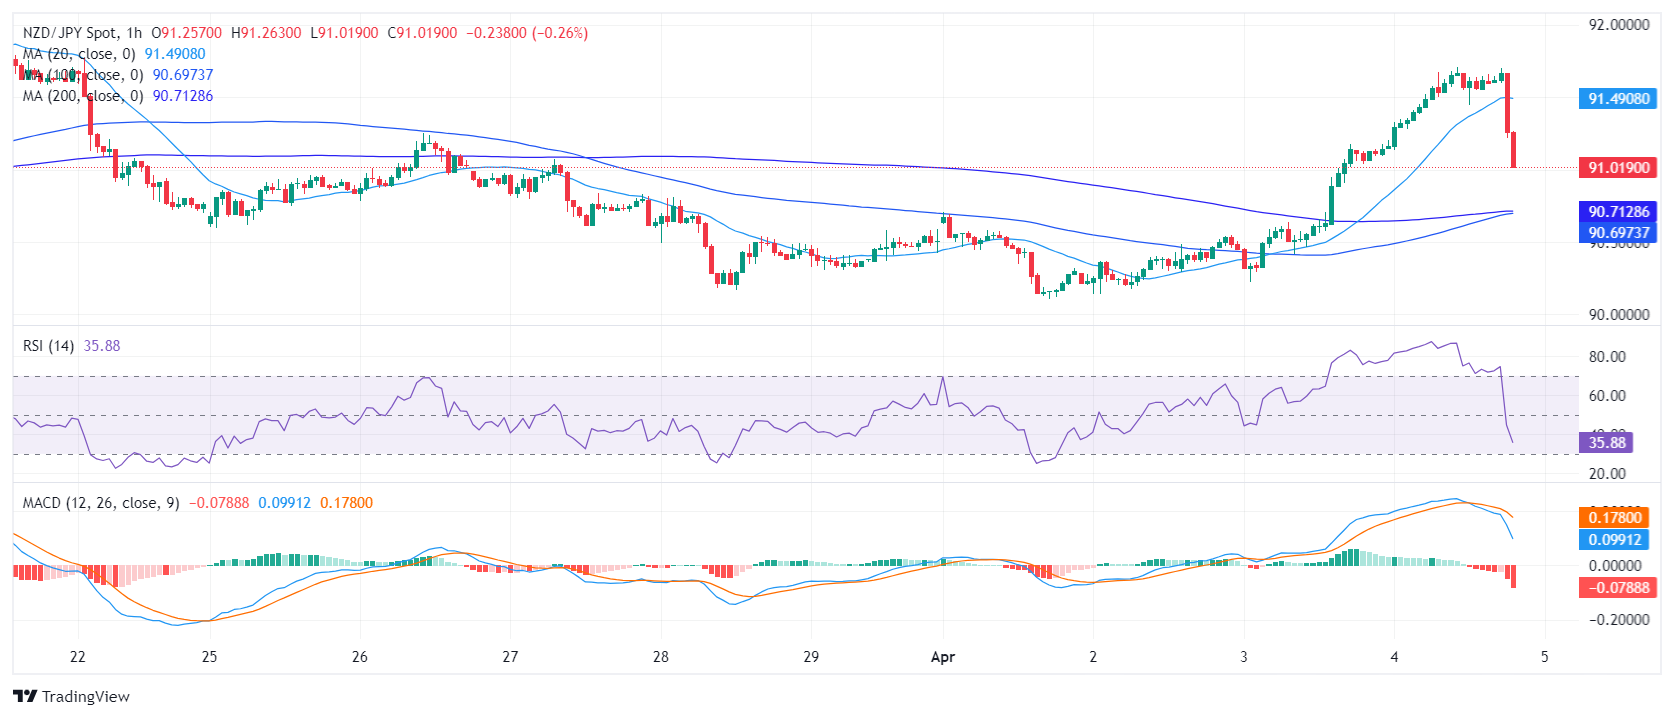
On the hourly RSI reading fell on the negative side after being near 70. The MACD histogram has begun to print rising red bars, also suggesting a rising negative momentum.
NZD/JPY hourly chart
Regarding the overall trend, the NZD/JPY pair jumped above the 20-day SMA today, often serving as a bullish short-term signal. In addition, the pair stands above its 100 and 200-day Simple Moving Average (SMA), also flashing a long-term positive outlook.
In conclusion, based on both the daily and hourly trends, plus taking the position in relation to the SMA into consideration, the NZD/JPY shows signs of a potential shift from a bearish to a bullish stance in the immediate term. However, if the bulls hold the above main SMAs, the outlook will still be positive.


© 2000-2026. All rights reserved.
This site is managed by Teletrade D.J. LLC 2351 LLC 2022 (Euro House, Richmond Hill Road, Kingstown, VC0100, St. Vincent and the Grenadines).
The information on this website is for informational purposes only and does not constitute any investment advice.
The company does not serve or provide services to customers who are residents of the US, Canada, Iran, The Democratic People's Republic of Korea, Yemen and FATF blacklisted countries.
Making transactions on financial markets with marginal financial instruments opens up wide possibilities and allows investors who are willing to take risks to earn high profits, carrying a potentially high risk of losses at the same time. Therefore you should responsibly approach the issue of choosing the appropriate investment strategy, taking the available resources into account, before starting trading.
Use of the information: full or partial use of materials from this website must always be referenced to TeleTrade as the source of information. Use of the materials on the Internet must be accompanied by a hyperlink to teletrade.org. Automatic import of materials and information from this website is prohibited.
Please contact our PR department if you have any questions or need assistance at pr@teletrade.global.
transfers